

Exploring the Sensitivity of Horn's Parallel Analysis to the Distributional Form of Random Data
- PMID: 20234802
- PMCID: PMC2838619
- DOI: 10.1080/00273170902938969
Exploring the Sensitivity of Horn's Parallel Analysis to the Distributional Form of Random Data
Abstract
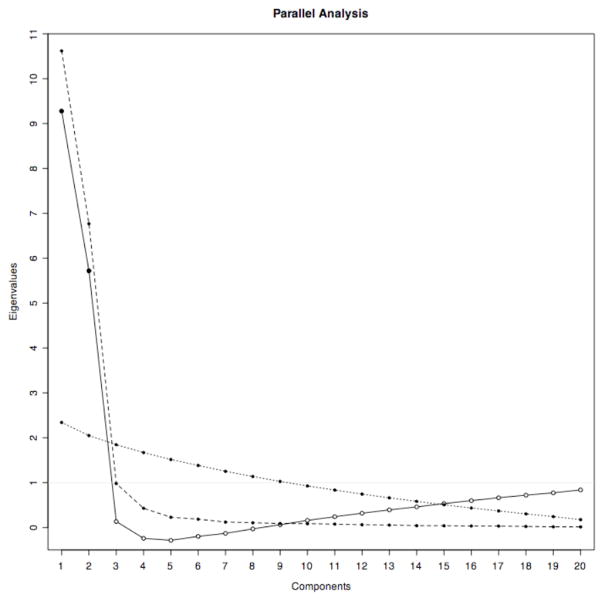
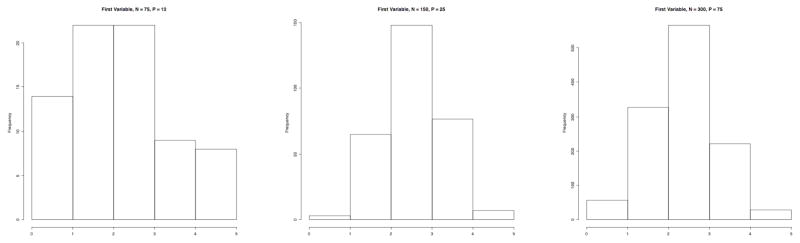
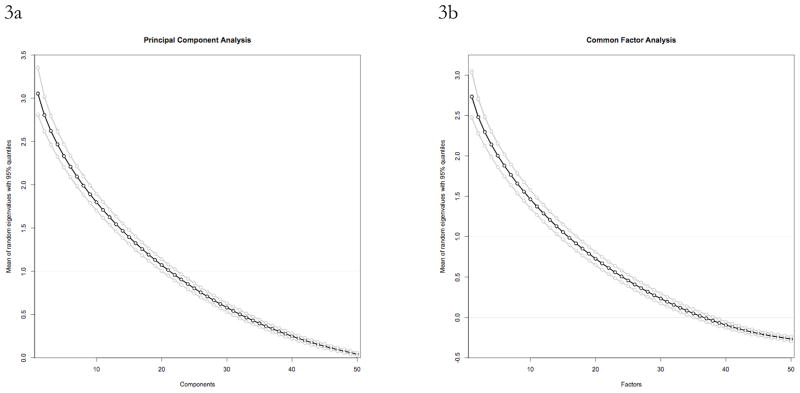
Horn's parallel analysis (PA) is the method of consensus in the literature on empirical methods for deciding how many components/factors to retain. Different authors have proposed various implementations of PA. Horn's seminal 1965 article, a 1996 article by Thompson and Daniel, and a 2004 article by Hayton, Allen, and Scarpello all make assertions about the requisite distributional forms of the random data generated for use in PA. Readily available software is used to test whether the results of PA are sensitive to several distributional prescriptions in the literature regarding the rank, normality, mean, variance, and range of simulated data on a portion of the National Comorbidity Survey Replication (Pennell et al., 2004) by varying the distributions in each PA. The results of PA were found not to vary by distributional assumption. The conclusion is that PA may be reliably performed with the computationally simplest distributional assumptions about the simulated data.
Figures
References
-
- Allen SJ, Hubbard R. Regression equations for the latent roots of random data correlation matrices with unities on the diagonal. Multivariate Behavioral Research. 1986;21:393–96. - PubMed
-
- Benjamini Y, Hochberg Y. Controlling the False Discovery Rate: A Practical and Powerful Approach to Multiple Testing. Journal of the Royal Statistical Society Series B (Methodological) 1995;57:289–300.
-
- Benjamini Y, Yekutieli D. The Control of the False Discovery Rate in Multiple Testing under Dependency. The Annals of Statistics. 2001;29:1165–1188.
-
- Browne MW, Cudeck R. Alternative Ways of Assessing Model Fit. Sociological Methods & Research. 1992;21:230.
-
- Cattell RB. The scree test for the number of factors. Multivariate Behavioral Research. 1966;1:245–276. - PubMed
Grants and funding
LinkOut - more resources
Full Text Sources
Molecular Biology Databases