Review
. 2010 Jul;77(7):591-606.
doi: 10.1002/cyto.a.20889.

Cytometry in cell necrobiology revisited. Recent advances and new vistas

Affiliations
Review

Cytometry in cell necrobiology revisited. Recent advances and new vistas

Donald Wlodkowic et al. Cytometry A. 2010 Jul.

Abstract

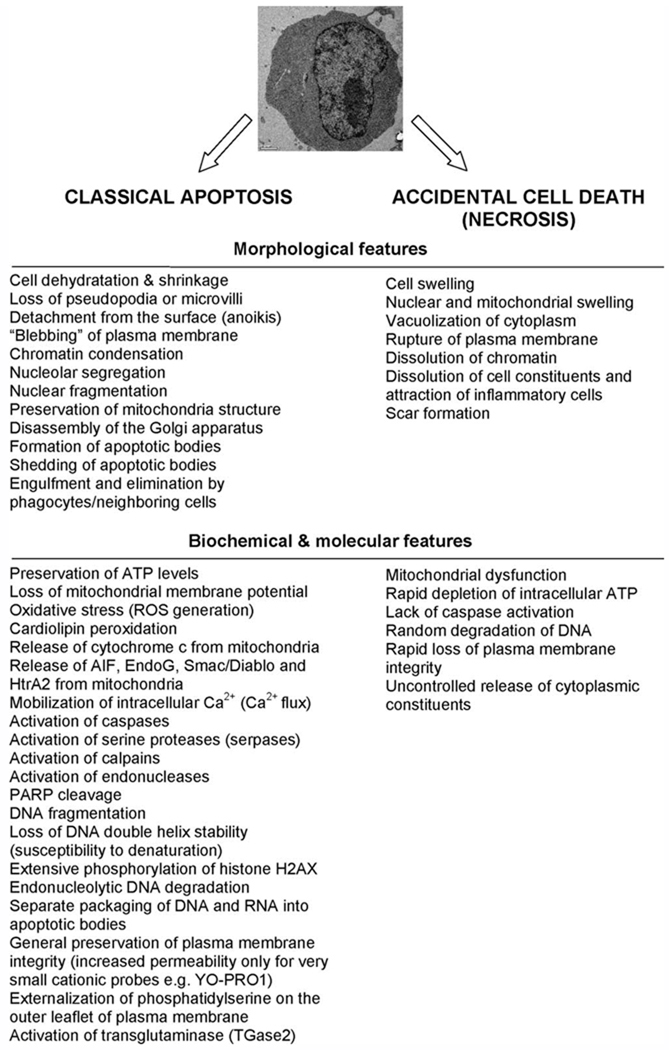
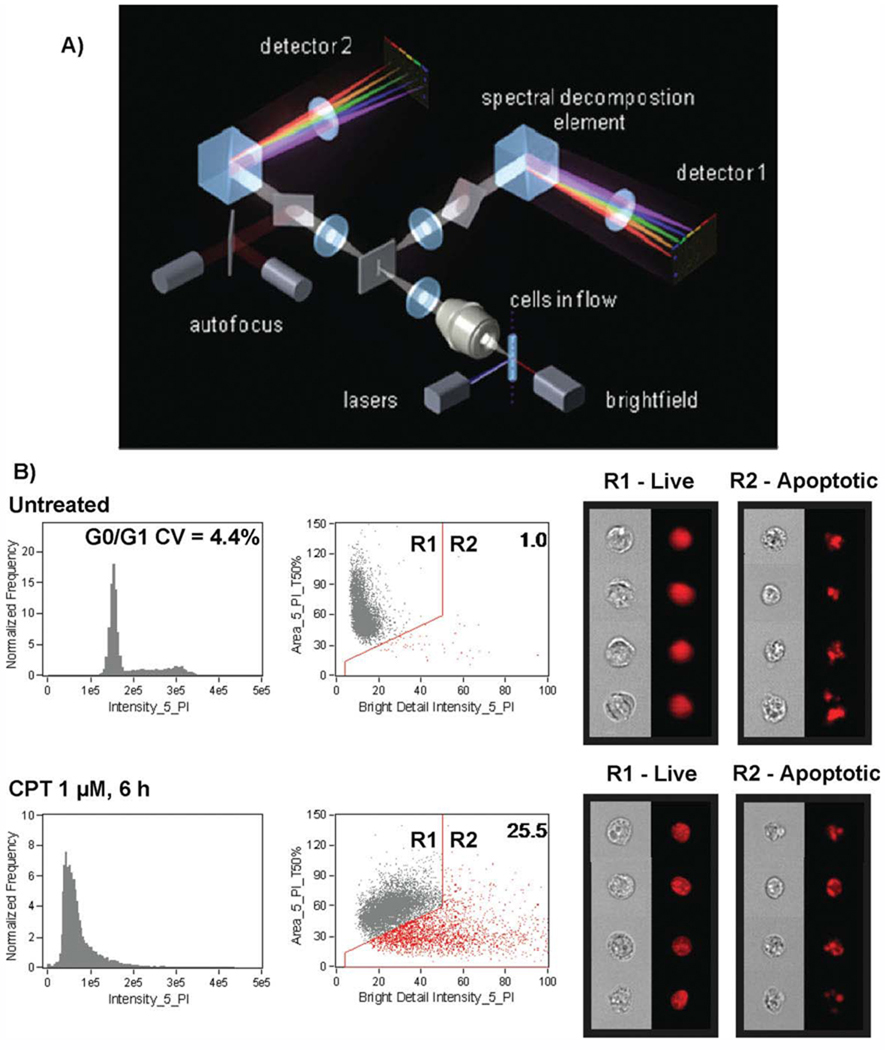
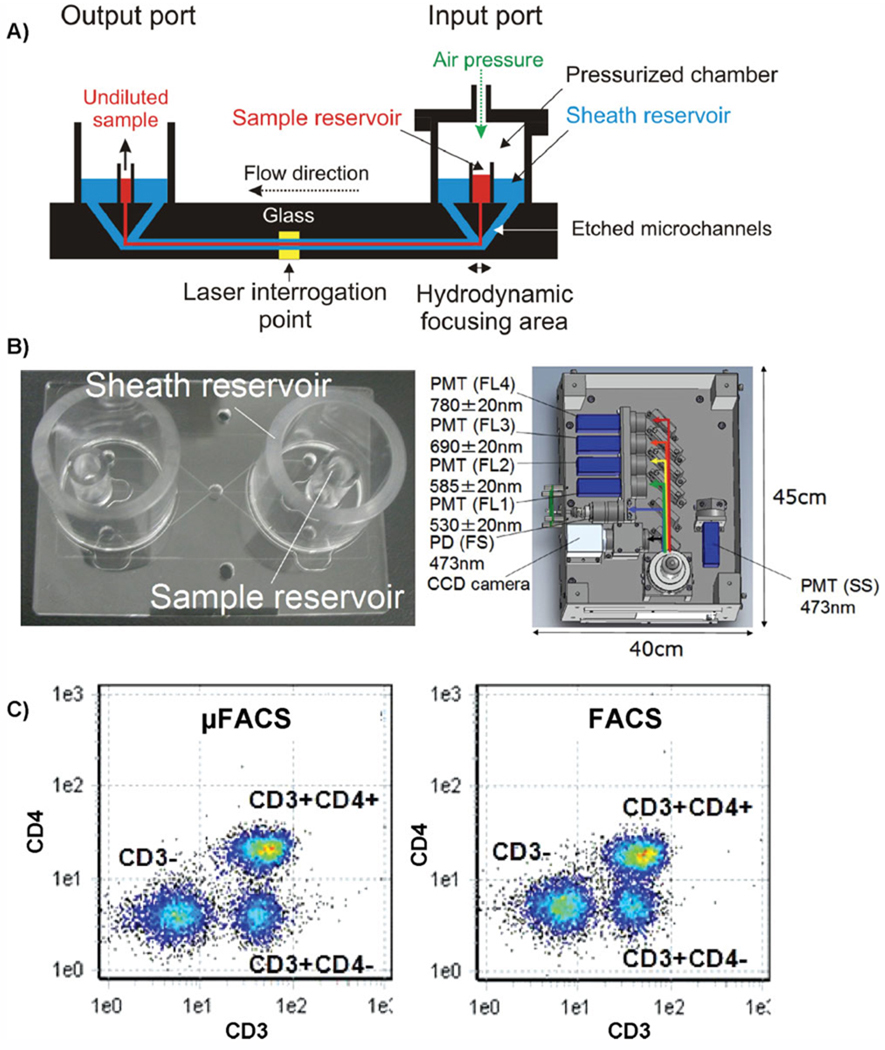
Over a decade has passed since publication of the last review on "Cytometry in cell necrobiology." During these years we have witnessed many substantial developments in the field of cell necrobiology such as remarkable advancements in cytometric technologies and improvements in analytical biochemistry. The latest innovative platforms such as laser scanning cytometry, multispectral imaging cytometry, spectroscopic cytometry, and microfluidic Lab-on-a-Chip solutions rapidly emerge as highly advantageous tools in cell necrobiology studies. Furthermore, we have recently gained substantial knowledge on alternative cell demise modes such as caspase-independent apoptosis-like programmed cell death (PCD), autophagy, necrosis-like PCD, or mitotic catastrophe, all with profound connotations to pathogenesis and treatment. Although detection of classical, caspase-dependent apoptosis is still the major ground for the advancement of cytometric techniques, there is an increasing demand for novel analytical tools to rapidly quantify noncanonical modes of cell death. This review highlights the key developments warranting a renaissance and evolution of cytometric techniques in the field of cell necrobiology.


Figures

Figure 1
Figure 1
Morphological and biochemical hallmarks of apoptosis and accidental cell death (necrosis). Note that some features characterizing apoptosis may not be present and depend heavily on a particular cell type, stimuli, and cellular microenvironment.
Figure 2
Figure 2
Multispectral imaging flow cytometer. (A) Layout and key components of the ImageStream high speed imaging system. Cells are hydrodynamically focused into a core stream and orthogonally illuminated with lasers for side scatter (SSC) and fluorescence imaging, and transilluminated for brightfield imaging. Light is collected from the cells with an imaging objective lens (20×, 40×, or 60×) and projected onto a charge-coupled detector (CCD). Before projection on the CCD, the light is passed through a spectral decomposition optical system that directs light of different wavelengths to different lateral positions across the detector, enabling simultaneous capture of up to six spectrally distinct images per detector. In the example shown, cells are illuminated by spatially separated lasers resulting in the generation of two composite images per cell. Each image is spectrally decomposed and projected onto separate detectors, enabling collection of up to 12 images per cell. (B) Morphology-based identification of apoptotic cells using Image Stream. Jurkat cells in midexponential growth were left untreated (top) or were incubated with 1 µM CPT for 6 hours, fixed and stained with PI, then collected on the ImageStream. DNA content histograms of single cells are shown in the left panels. Cells exhibiting nuclear fragmentation (low nuclear area and bright detail intensity) are gated in the histograms at right, with the percentage of apoptotic cells indicated in the upper right corner of the plot. Representative brightfield and PI image of nonapoptotic cells from the untreated sample and apoptotic cells from the treated sample are shown at right (data courtesy of Dr. Tad George and Dr. Brian Hall, Amnis Corporation, Seattle, WA) (31,40). [Color figure can be viewed in the online issue, which is available at www.interscience.wiley.com]
Figure 3
Figure 3
Advanced microfluidic flow cytometer (Fishman-R). (A) Cross-sectional view of the microfluidic chip. (B) Disposable microfluidic cartridge (left panel) and an optical layout of the microcytometer (right panel). Note FSC, SSC, and four fluorescence detectors used in combination with spatially separated solid state 473 nm and 640 nm lasers. Side scatter detection is performed using innovative Side scattered Light detection using Edge Reflection (SLER) technology. (C) Immunophenotyping performed on the microfluidic Fishman-R flow cytometer as compared with conventional flow cytometer. Note that µFACS analysis requires merely 20 µl of blood and yields comparative multiparameter data to FACS (data courtesy of Dr. Kazuo Takeda, On-Chip Biotechnologies Co, Tokyo, Japan) (74,75). [Color figure can be viewed in the online issue, which is available at www.interscience.wiley.com]
Figure 4
Figure 4
Apoptotic changes in plasma membrane. (A) Detection of apoptosis by concurrent staining with annexin V-APC and PI. Human B-cell lymphoma cells were untreated (left panel) or treated with dexamethasone (right panel), as described previously (73). Cells were subsequently stained with Annexin V—APC conjugate and PI and their far-red and red fluorescence was measured by flow cytometry. Live cells (V) are both Annexin V and PI negative. At early stage of apoptosis (A) the cells bind Annexin V while still excluding PI. At late stage of apoptosis (N) they bind Annexin V-FITC and stain brightly with PI. (B) Detection of apoptosis by concurrent staining with YO-PRO 1 and PI. Cells were treated as in A) and supravitaly stained with YO-PRO 1 and PI probes. Their green and red fluorescence was measured by flow cytometry. Live cells (V) are both YO-PRO 1 and PI negative. Early apoptotic cells (A) are permeant to YO-PRO 1, but still exclude PI. Late apoptotic/ secondary necrotic cells (N) are permeant to both probes (double positive events). (C) Comparison between Annexin V and YO-PRO 1 based assays (for details refer to text). Cells were treated as in (A) and supravitally stained with Annexin V-APC, YO-PRO 1, and PI probes. PI positive cells were electronically excluded from subsequent analysis. Note that essentially all cells that responded to dexamethasone by increase in Annexin V binding were YO-PRO 1 positive. Nevertheless, large fraction of YO-PRO 1 positive cells did not bind Annexin V (arrow). These data indicate that time-window for YO-PRO 1 assay is wider than for Annexin V binding, and precedes the latter. For details refer to text.
Figure 5
Figure 5
Identification of apoptotic cells based on high level of expression of γH2AX. Leukemic HL-60 cells were untreated (Ctrl) or treated with 150 nM topotecan (Tpt) for 1 or 3 hours. Expression of γH2AX and of activated (cleaved) caspase-3 (caspase-3*) was detected immunocytochemically using fluorochromes of different emission wavelength, DNA was counterstained with DAPI, fluorescence measured by laser scanning cytometry. Induction of primary DNA double-strand breaks (Pr-DSB) by Tpt triggers H2AX phosphorylation (induction of γH2AX) which is evident after 1 hour. DNA fragmentation during apoptosis which occurs after 3 hours generates high number of DSB which leads to an additional, very intense response by expression of γH2AX. Apoptotic cells, Ap, are characterized by both, activation of caspase-3 and very high level of γH2AX. The dashed straight lines show the maximal threshold of γH2AX and caspase-3* expression (mean + 3 SD) of the untreated cells. Compared with early apoptotic cells expression of γH2AX is reduced during late phase of apoptosis (—110).
Figure 6
Figure 6
Supravital assessment of DNA content. (A) Comparison between propidium iodide (PI), DRAQ5, and DyeCycle Orange (DCO) probes. Human histiocytic leukemia U937 cells were challenged with topoisomerase II inhibitor (Etoposide); topoisomerase I inhibitor (Camptothecin), or left untreated (Control). Cells were live stained with DRAQ5 and DCO for 20 minutes at RT. For PI staining cells were harvested, permeabilized in 70% EtOH, and digested with RNase A. Note that resolution of DNA profile when using DRAQ5 and DCO is satisfactory to assess cell cycle block in response to Etoposide and Camptothecin. Interestingly both DRAQ5 and DCO permit also for supravital assessment of sub-G1 fraction. (B) Comparison between DRAQ5 and ethidium bromide in a HTS screen of selected anticancer drugs. Note that permeabilisation and fixation result in loss of informative cells in the sub-G1 fraction (thick arrow). The same population is retained when DRAQ5 is applied supravitaly for DNA content analysis (data courtesy of Roy Edward, Biostatus Limited Shepshed, UK) (—117). [Color figure can be viewed in the online issue, which is available at www.interscience.wiley.com]

Similar articles

Cited by

References

    1. Darzynkiewicz Z, Juan G, Li X, Gorczyca W, Murakami T, Traganos F. Cytometry in cell necrobiology: Analysis of apoptosis and accidental cell death (necrosis) Cytometry. 1997;27:1–20. - PubMed
    1. Darzynkiewicz Z, Bedner E, Traganos F. Difficulties and pitfalls in analysis of apoptosis. Methods Cell Biol. 2001;63:527–546. - PubMed
    1. Telford WG, Komoriya A, Packard BZ. Multiparametric analysis of apoptosis by flow and image cytometry. Methods Mol Biol. 2004;263:141–160. - PubMed
    1. Darzynkiewicz Z, Huang X, Okafuji M, King MA. Cytometric methods to detect apoptosis. Methods Cell Biol. 2004;75:307–341. - PubMed
    1. Bonetta L. Flow cytometry smaller and better. Nat Methods. 2005;2:785–795.

Publication types

MeSH terms

LinkOut - more resources