Determination of the phase diagram for soluble and membrane proteins
- PMID: 20235520
- PMCID: PMC2848416
- DOI: 10.1021/jp911780z
Determination of the phase diagram for soluble and membrane proteins
Abstract
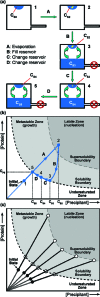
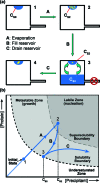
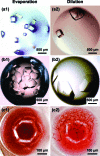
Methods to efficiently determine the phase behavior of novel proteins have the potential to significantly benefit structural biology efforts. Here, we present protocols to determine both the solubility boundary and the supersolubility boundary for protein/precipitant systems using an evaporation-based crystallization platform. This strategy takes advantage of the well-defined rates of evaporation that occur in this platform to determine the state of the droplet at any point in time without relying on an equilibrium-based end point. The dynamic nature of this method efficiently traverses phase space along a known path, such that a solubility diagram can be mapped out for both soluble and membrane proteins while using a smaller amount of protein than what is typically used in optimization screens. Furthermore, a variation on this method can be used to decouple crystal nucleation and growth events, so fewer and larger crystals can be obtained within a given droplet. The latter protocol can be used to rescue a crystallization trial where showers of tiny crystals were observed. We validated both of the protocols to determine the phase behavior and the protocol to optimize crystal quality using the soluble proteins lysozyme and ribonuclease A as well as the membrane protein bacteriorhodopsin.
Figures


Similar articles
-
A novel approach for the crystallization of soluble proteins using non-ionic surfactants.Acta Crystallogr D Biol Crystallogr. 1998 Jan 1;54(Pt 1):154-8. doi: 10.1107/s0907444997009074. Acta Crystallogr D Biol Crystallogr. 1998. PMID: 9867432
-
The effect of protein-precipitant interfaces and applied shear on the nucleation and growth of lysozyme crystals.Acta Crystallogr D Biol Crystallogr. 2009 Nov;65(Pt 11):1127-39. doi: 10.1107/S0907444909031527. Epub 2009 Oct 22. Acta Crystallogr D Biol Crystallogr. 2009. PMID: 19923710 Free PMC article.
-
Iterative operations on microdroplets and continuous monitoring of processes within them; determination of solubility diagrams of proteins.Lab Chip. 2012 Oct 21;12(20):4022-5. doi: 10.1039/c2lc40174f. Lab Chip. 2012. PMID: 22868285 Review.
-
Scientific approach to the optimization of protein crystallization conditions for microgravity experiments.Ann N Y Acad Sci. 2004 Nov;1027:28-47. doi: 10.1196/annals.1324.004. Ann N Y Acad Sci. 2004. PMID: 15644343
-
It's not just a phase: crystallization and X-ray structure determination of bacteriorhodopsin in lipidic cubic phases.Structure. 1998 Jan 15;6(1):5-10. doi: 10.1016/s0969-2126(98)00002-1. Structure. 1998. PMID: 9493262 Review.
Cited by
-
A crystallization apparatus for temperature-controlled flow-cell dialysis with real-time visualization.J Appl Crystallogr. 2016 Apr 22;49(Pt 3):806-813. doi: 10.1107/S1600576716004635. eCollection 2016 Jun 1. J Appl Crystallogr. 2016. PMID: 27275137 Free PMC article.
-
Computational crystallization.Arch Biochem Biophys. 2016 Jul 15;602:12-20. doi: 10.1016/j.abb.2016.01.004. Epub 2016 Jan 11. Arch Biochem Biophys. 2016. PMID: 26792536 Free PMC article. Review.
-
Droplet-Based Evaporative System for the Estimation of Protein Crystallization Kinetics.Cryst Growth Des. 2021 Nov 3;21(11):6064-6075. doi: 10.1021/acs.cgd.1c00231. Epub 2021 Oct 18. Cryst Growth Des. 2021. PMID: 34759784 Free PMC article.
-
A Stochastic Model for Nucleation Kinetics Determination in Droplet-Based Microfluidic Systems.Cryst Growth Des. 2010 May 10;10(6):2515-2521. doi: 10.1021/cg900830y. Cryst Growth Des. 2010. PMID: 20953348 Free PMC article.
-
Crystallization screening: the influence of history on current practice.Acta Crystallogr F Struct Biol Commun. 2014 Jul;70(Pt 7):835-53. doi: 10.1107/S2053230X1401262X. Epub 2014 Jun 27. Acta Crystallogr F Struct Biol Commun. 2014. PMID: 25005076 Free PMC article. Review.
References
Publication types
MeSH terms
Substances
Grants and funding
LinkOut - more resources
Full Text Sources

