. 2010 Mar 17:11:183.
doi: 10.1186/1471-2164-11-183.

Complementary transcriptomic, lipidomic, and targeted functional genetic analyses in cultured Drosophila cells highlight the role of glycerophospholipid metabolism in Flock House virus RNA replication

Affiliations

Complementary transcriptomic, lipidomic, and targeted functional genetic analyses in cultured Drosophila cells highlight the role of glycerophospholipid metabolism in Flock House virus RNA replication

Kathryn M Castorena et al. BMC Genomics. .

Abstract

Background: Cellular membranes are crucial host components utilized by positive-strand RNA viruses for replication of their genomes. Published studies have suggested that the synthesis and distribution of membrane lipids are particularly important for the assembly and function of positive-strand RNA virus replication complexes. However, the impact of specific lipid metabolism pathways in this process have not been well defined, nor have potential changes in lipid expression associated with positive-strand RNA virus replication been examined in detail.

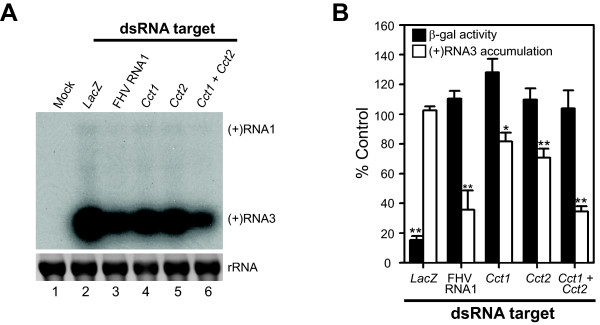
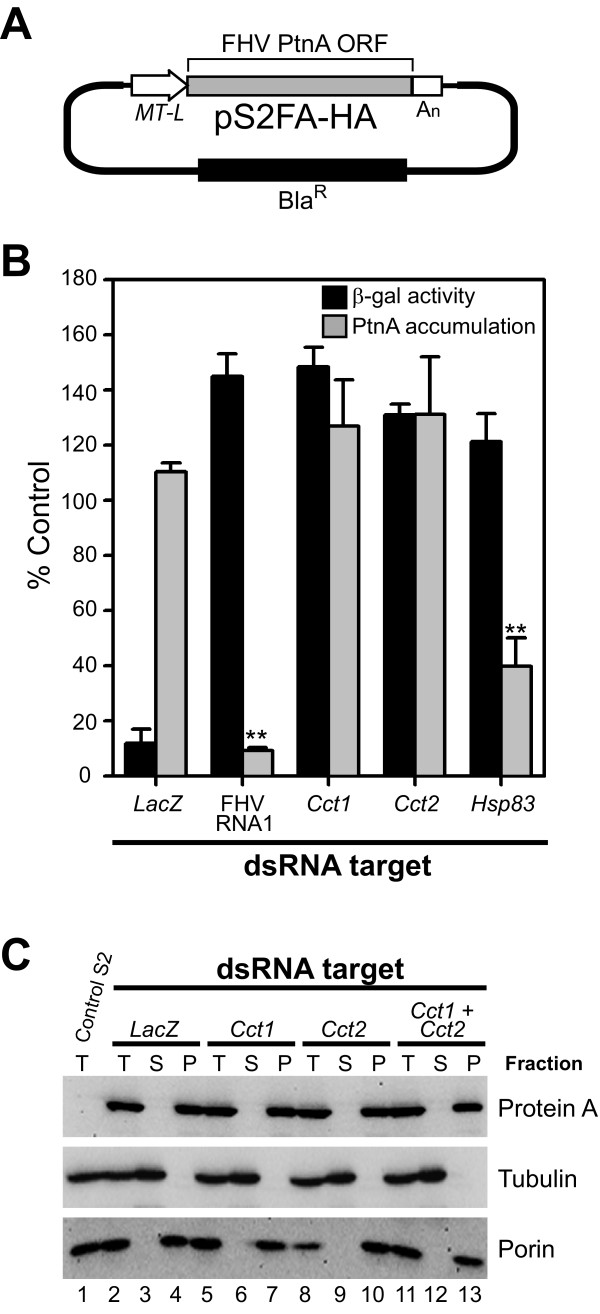
Results: In this study we used parallel and complementary global and targeted approaches to examine the impact of lipid metabolism on the replication of the well-studied model alphanodavirus Flock House virus (FHV). We found that FHV RNA replication in cultured Drosophila S2 cells stimulated the transcriptional upregulation of several lipid metabolism genes, and was also associated with increased phosphatidylcholine accumulation with preferential increases in lipid molecules with longer and unsaturated acyl chains. Furthermore, targeted RNA interference-mediated downregulation of candidate glycerophospholipid metabolism genes revealed a functional role of several genes in virus replication. In particular, we found that downregulation of Cct1 or Cct2, which encode essential enzymes for phosphatidylcholine biosynthesis, suppressed FHV RNA replication.

Conclusion: These results indicate that glycerophospholipid metabolism, and in particular phosphatidylcholine biosynthesis, plays an important role in FHV RNA replication. Furthermore, they provide a framework in which to further explore the impact of specific steps in lipid metabolism on FHV replication, and potentially identify novel cellular targets for the development of drugs to inhibit positive-strand RNA viruses.


Figures

Figure 1
Figure 1
FHV genome and replicon schematics and replication strategy. (A) FHV genome is bipartite with 3.1 kb (RNA1) and 1.4 kb (RNA2) segments, and during replication a 0.4 kb subgenomic (sg) segment (RNA3) is also produced. RNA1 encodes protein A, the FHV RNA-dependent RNA polymerase (RdRp), RNA2 encodes the FHV structural protein precursor, and RNA3 encodes the RNA interference (RNAi) suppressor protein B2 (PtnB2). (B) Schematic of pS2F1, a metallothionein (MT) promoter-driven plasmid that expresses an FHV RNA1 replicon. Authentic viral 5' and 3' termini are generated by precise transcription initiation and a hepatitis δ ribozyme (δRz), respectively. The asterisk indicates the position of the frame-shifting mutation in pS2F1fs that results in the production of a truncated and non-functional RNA polymerase. Expression of the blasticidin-resistance gene (BlaR) used for selection is controlled by the copia transposon LTR constitutive promoter. (C) Strategy for FHV genome replication initiated by infection or replicon transfection. The intracellular events indicated in bold type are common for FHV RNA replication initiated via either infection or replicon induction.
Figure 2
Figure 2
FHV infection and replicon expression upregulate partially overlapping sets of Drosophila genes. (A) Venn diagram indicating the number of upregulated genes unique to FHV-infected cells (white circle), unique to FHV replicon-expressing cells (grey circle), or upregulated with both (black convergence). Total numbers of genes are given within the indicated regions, and complete lists and descriptions of genes are provided in Table 1 and as Additional Files 1, 2 and 3. Specific upregulated genes involved in lipid metabolism, as identified by GO terms, are shown by either their gene symbols or CG designations. (B) Semi-quantitative RT-PCR validation of Cct1 and Cct2 mRNA upregulation in Drosophila S2 cells infected with FHV. Decreasing amounts of cDNA generated by RT with oligo-dT primers and equivalent amounts of total RNA from mock (upper gel) or FHV-infected S2 cells (lower gel) were amplified with gene-specific primers for Drosophila actin (Act5C), Cct1, or Cct2, and PCR products were examined by agarose gel electrophoresis and ethidium bromide staining. The expression level of the Act5C transcript in microarray experiments was not significantly altered with FHV infection or replicon expression. Densitometry analysis of PCR products generated from cDNA dilutions that produced submaximal signals showed that FHV infection induced 2.0 ± 0.2 and 2.3 ± 0.3 fold increases in Cct1 and Cct2 mRNA levels, respectively, consistent with quantitative microarray results (see Additional File 1). (C) Semi-quantitative RT-PCR validation of Cct1 and Cct2 mRNA upregulation in Drosophila S2 cells expressing an FHV replicon. RT-PCR was performed as described above with total RNA from S2 cells containing the control plasmid pS2F1fs (upper gel) or FHV replicon-encoding plasmid pS2F1 (lower gel). Densitometry analysis of PCR products as described above showed that FHV replicon expression induced 1.9 ± 0.2 and 2.8 ± 0.9 fold increases in Cct1 and Cct2 mRNA levels, respectively, consistent with quantitative microarray results (see Additional File 2).
Figure 3
Figure 3
FHV infection and replicon expression modulate phospholipid levels in Drosophila S2 cells. (A) Total PC levels in S2 cells infected with FHV or treated with miltefosine (left graph) or expressing an FHV RNA1 replicon (right graph). Total PC levels were determined in cells 24 h after infection, treatment, or replicon induction and are expressed relative to total cellular protein levels. (B) Phospholipid species distribution in control S2 cells, cells infected with FHV, or cells treated with miltefosine or oleic acid. Relative phospholipid species content is expressed as a molar percentage of total phospholipid content and was determined by ESI-MS/MS. (C) PC acyl chain length in mock, FHV-infected, and oleic acid-treated S2 cells. Total PC chain length was determined by ESI-MS/MS and represents the total number of carbons from both acyl chains. (D) PC acyl chain saturation in mock, FHV-infected, and oleic acid-treated S2 cells. Total number of C = C double bonds in PC species was determined by ESI-MS/MS and represents the total number of double bonds in both acyl chains. The fraction of PC species with greater than two double bonds was 0.5 to 1.5% for both mock and FHV-infected cells (see Additional File 4), and therefore these results were not included in the graph. (E) PC, PE, and PI species with acyl chains containing a total of 34 carbons and 2 double bonds in mock and FHV-infected S2 cells. P-value < 0.05* or 0.005**.
Figure 4
Figure 4
RNAi-mediated knockdown of Drosophila genes involved in glycerophospholipid metabolism modulate FHV replication in S2 cells. (A) Medium throughput RNAi-based functional screen of select glycerophospholipid metabolism genes. Drosophila S2 cells were cultured in 96-well plates, incubated with dsRNA targeting specific glycerophospholipid metabolism-related genes, positive control FHV RNA1, or negative control LacZ for 48 h, infected with FHV, and harvested 18 h after infection. As an additional separate control, selected wells were treated with 50 μM miltefosine at the time of infection. FHV replication was assayed by protein B2 (PtnB2)-specific capture ELISA. Parallel MTT viability assays demonstrated > 90% viability for all dsRNA- or miltefosine-treated samples compared to LacZ dsRNA-treated control (data not shown). Results are expressed as the percentage of PtnB2 accumulation relative to LacZ dsRNA-treated control (hatched line). P-value < 0.05* or 0.005**. (B) Schematic of eukaryotic glycerophospholipid synthesis pathways. The simplified biosynthetic pathways shown were adapted from the detailed and comprehensive KEGG glycerophospholipid metabolism pathway available at http://www.genome.jp/kegg/. Drosophila genes with known or hypothesized lipid biosynthetic functions are shown, and those identified as being functionally important for FHV RNA replication are boxed in grey. The major eukaryotic glycerophospholipids are indicated in bold type: CL, cardiolipin; PA, phosphatidic acid; PC, phosphatidylcholine; PE, phosphatidylethanolamine; PG, phosphatidylglycerol; PI, phosphatidylinositol; PS, phosphatidylserine. The essential precursor glycerol-3-phosphate and important intermediates are shown in italics: DAG, diacylglycerol.
Figure 5
Figure 5
Verification of Cct1 and Cct2 roles in modulating FHV replication in infected S2 cells. (A) RT-PCR validation of Cct1 or Cct2 RNAi-mediated knockdown. Drosophila S2 cells were treated with dsRNAs specific for LacZ (lane 1), Cct1 (lane 2), Cct2 (lane 3), or both Cct1 and Cct2 (lane 4) for 72 h, and gene-specific mRNA expression was examined by semi-quantitative RT-PCR as described in Fig. 2, except that only results from cDNA dilutions that produced submaximal signals are shown. (B) Total PC content in cells treated with the dsRNAs described above. PC levels were determined as in Fig. 3. (C) Viability of cells treated with dsRNAs described above determined by MTT assay. (D) FHV RNA accumulation in infected S2 cells after RNAi-mediated knockdown of Cct1, Cct2, or both. Mock-infected cells (lane 1), cells treated with the indicated dsRNA as described above or FHV RNA1 as a positive control (lanes 2-6), or treated with 50 μM miltefosine (lane 7), were infected with FHV and viral-specific RNAs or protein were analyzed by northern blotting or immunoblotting 12 h after infection, respectively. For viral RNA analysis, blots for positive-sense (+) and negative-sense (-) genomic RNA1 and subgenomic (+)RNA3 are shown. The decrease in (+)RNA1 accumulation in Cct1 knockdown cells (lane 4) was not consistently seen in all experiments. Ribosomal RNA (rRNA) bands detected by ethidium bromide staining are shown as loading controls. For protein analysis, blots for FHV protein A and the cellular loading control tubulin are shown. (E) Quantitative data for genomic (+)RNA1 and (-)RNA1, subgenomic (+)RNA3, and protein A accumulation in S2 cells treated with the indicated dsRNA or miltefosine after infection with FHV. Results are expressed as percentage of accumulation relative to LacZ dsRNA-treated control. P-value < 0.05* or 0.005**.
Figure 6
Figure 6
Verification of Cct1 and Cct2 roles in modulating FHV RNA replication in replicon-bearing S2 cells. (A) Northern blot of FHV genomic (+)RNA1 and subgenomic (+)RNA3 accumulation in FHV replicon-bearing S2 cells after RNAi-mediated knockdown of Cct1, Cct2, or both. Mock transfected cells (lane 1) or cells treated with dsRNA against LacZ (lane 2), FHV RNA1 (lanes 3), Cct1 (lane 4), Cct2 (lane 5), or both Cct1 and Cct2 (lane 5) and co-transfected with pS2F1 and pS2LacZ were induced with 0.5 mM Cu2+ for 18 h and FHV RNA accumulation was determined by northern blotting as described in Fig. 5. The position of FHV subgenomic (+)RNA3 is shown on the right, and ribosomal RNA (rRNA) bands are shown as loading controls. The position of genomic (+)RNA1, which is barely detectable in transiently transfected S2 cells, is also shown on the right. (B) Quantitative data for subgenomic (+)RNA3 and β-galactosidase activity in S2 cells co-transfected with pS2F1 and pS2LacZ after RNAi-mediated knockdown of the indicated dsRNA targets. P-value < 0.05* or 0.005**.
Figure 7
Figure 7
RNAi-mediated knockdown of Cct1 or Cct2 does not modulate FHV protein A accumulation or membrane association in S2 cells. (A) Schematic of FHV protein A expression vector with C-terminal HA tag. The RNA template produced from pS2FA-HA is optimized for translation by inclusion of a 5' leader sequence (L) and a 3' polyadenylation signal (An), but these alterations in addition to the C-terminal HA tag render the RNA template incompetent for viral RNA replication due to changes in essential 5' and 3' cis elements. (B) FHV protein A accumulation determined by quantitative immunoblotting and β-galactosidase activity determined by enzyme assay in S2 cells co-transfected with pS2FA-HA and pS2LacZ after RNAi-mediated knockdown of the indicated dsRNA targets. P-value < 0.05* or 0.005**. (C) S2 cells stably expressing either an empty vector (lane 1) or pS2FA-HA (lanes 2-13) were treated with dsRNA targeting LacZ (lanes 2-4), Cct1 (lanes 5-7), Cct2 (lanes 8-10), or both Cct1 and Cct2 (lanes 11-13) for 72 h, induced with 0.5 mM Cu2+ for 18 h, washed in PBS, and either lysed directly in SDS-PAGE buffer to obtain total fractions (T) or subjected to saponin-mediated permeabilization and differential centrifugation to obtain soluble (S) and pellet (P) fractions, which correspond to cytosolic and membrane protein fractions, respectively [22]. Fractions were analyzed by SDS-PAGE and immunoblotting for protein A, the cytosolic protein tubulin, or the membrane protein porin.

Similar articles

Cited by

References

    1. Fox JL. Antivirals become a broader enterprise. Nat Biotechnol. 2007;25(12):1395–1402. doi: 10.1038/nbt1207-1395. - DOI - PMC - PubMed
    1. Miller S, Krijnse-Locker J. Modification of intracellular membrane structures for virus replication. Nat Rev Microbiol. 2008;6(5):363–374. doi: 10.1038/nrmicro1890. - DOI - PMC - PubMed
    1. Ahlquist P, Noueiry AO, Lee WM, Kushner DB, Dye BT. Host factors in positive-strand RNA virus genome replication. J Virol. 2003;77(15):8181–8186. doi: 10.1128/JVI.77.15.8181-8186.2003. - DOI - PMC - PubMed
    1. Denison MR. Seeking membranes: positive-strand RNA virus replication complexes. PLoS Biol. 2008;6(10):e270. doi: 10.1371/journal.pbio.0060270. - DOI - PMC - PubMed
    1. Salonen A, Ahola T, Kaariainen L. Viral RNA replication in association with cellular membranes. Curr Top Microbiol Immunol. 2005;285:139–173. full_text. - PMC - PubMed

Publication types

MeSH terms