. 2010 Mar 17:8:22.
doi: 10.1186/1741-7007-8-22.

Geographic and ecologic heterogeneity in elimination thresholds for the major vector-borne helminthic disease, lymphatic filariasis

Affiliations

Geographic and ecologic heterogeneity in elimination thresholds for the major vector-borne helminthic disease, lymphatic filariasis

Manoj Gambhir et al. BMC Biol. .

Abstract

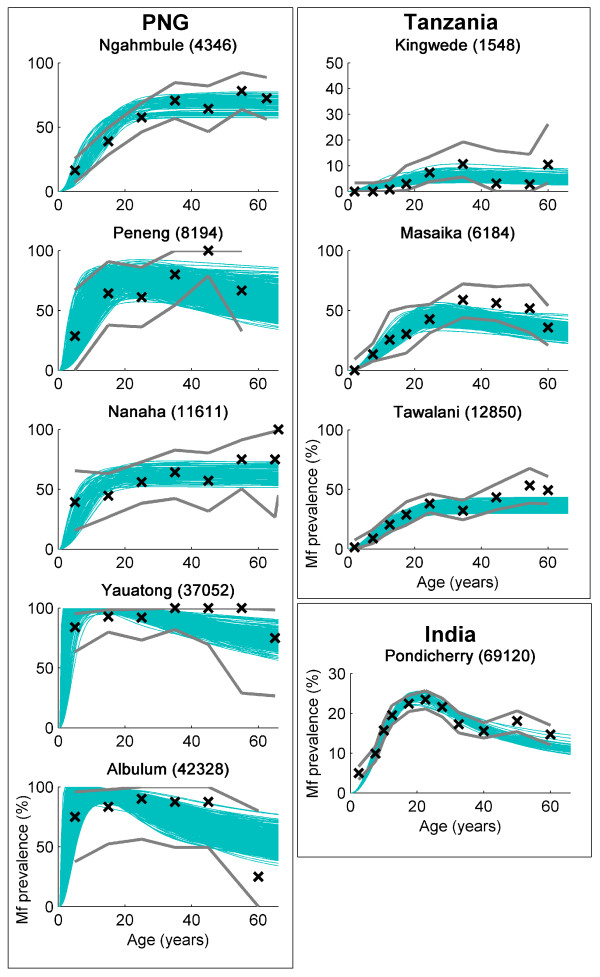
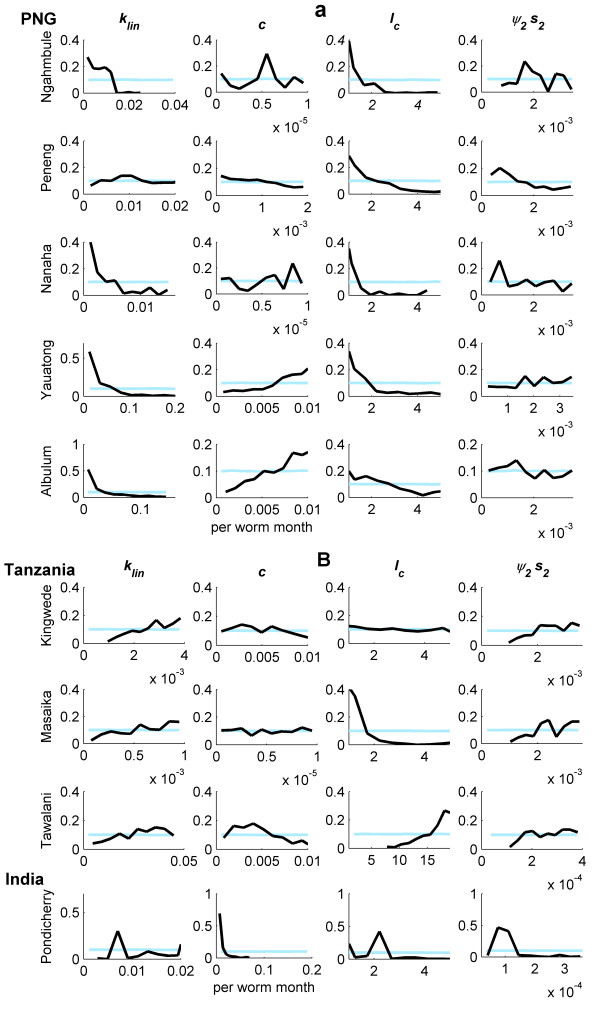
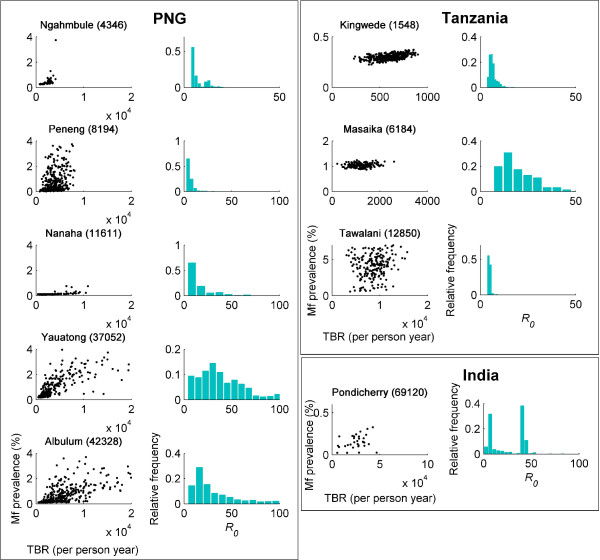
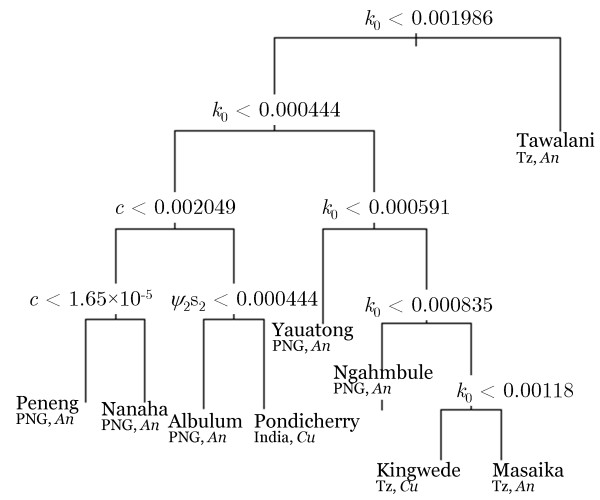
Background: Large-scale intervention programmes to control or eliminate several infectious diseases are currently underway worldwide. However, a major unresolved question remains: what are reasonable stopping points for these programmes? Recent theoretical work has highlighted how the ecological complexity and heterogeneity inherent in the transmission dynamics of macroparasites can result in elimination thresholds that vary between local communities. Here, we examine the empirical evidence for this hypothesis and its implications for the global elimination of the major macroparasitic disease, lymphatic filariasis, by applying a novel Bayesian computer simulation procedure to fit a dynamic model of the transmission of this parasitic disease to field data from nine villages with different ecological and geographical characteristics. Baseline lymphatic filariasis microfilarial age-prevalence data from three geographically distinct endemic regions, across which the major vector populations implicated in parasite transmission also differed, were used to fit and calibrate the relevant vector-specific filariasis transmission models. Ensembles of parasite elimination thresholds, generated using the Bayesian fitting procedure, were then examined in order to evaluate site-specific heterogeneity in the values of these thresholds and investigate the ecological factors that may underlie such variability

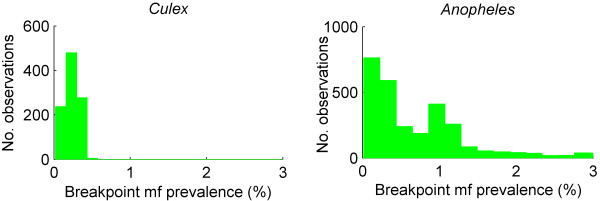
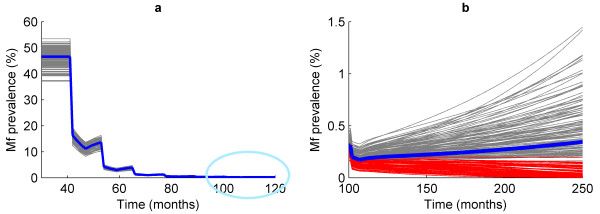
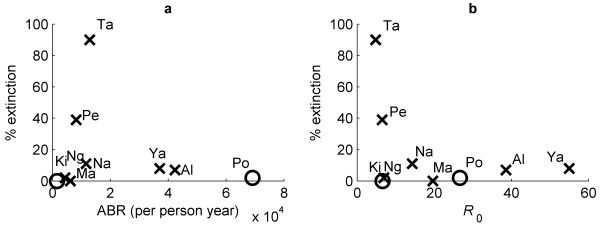
Results: We show that parameters of density-dependent functions relating to immunity, parasite establishment, as well as parasite aggregation, varied significantly between the nine different settings, contributing to locally varying filarial elimination thresholds. Parasite elimination thresholds predicted for the settings in which the mosquito vector is anopheline were, however, found to be higher than those in which the mosquito is culicine, substantiating our previous theoretical findings. The results also indicate that the probability that the parasite will be eliminated following six rounds of Mass Drug Administration with diethylcarbamazine and albendazole decreases markedly but non-linearly as the annual biting rate and parasite reproduction number increases.

Conclusions: This paper shows that specific ecological conditions in a community can lead to significant local differences in population dynamics and, consequently, elimination threshold estimates for lymphatic filariasis. These findings, and the difficulty of measuring the key local parameters (infection aggregation and acquired immunity) governing differences in transmission thresholds between communities, mean that it is necessary for us to rethink the utility of the current anticipatory approaches for achieving the elimination of filariasis both locally and globally.


Figures

Figure 1
Figure 1
Observed and fitted microfilarial age-prevalence curves for each endemic setting. The 500 curves (blue solid lines) generated by importance resampling of the input parameter sets according to their likelihood are displayed against observed data (black crosses with solid black lines showing upper and lower 95% confidence intervals of the data) for each of the communities investigated in this study. Five hundred unique curves may not be seen in each case since those with the highest likelihood will be plotted several times. Each of the curves represents an equilibrium solution to the model described in the text, given the actual annual biting rate (values in parentheses) obtained in each community. The appropriate vector uptake function (corresponding to the Anopheles or Culex species) was used in each case. Country and village names are given above each plot.
Figure 2
Figure 2
Prior and posterior model parameter distributions for the data from each community. A comparison of the prior (light blue lines) and posterior (black lines) parameter relative frequency distributions obtained from model fits to age-mf prevalence data in each of the study villages (the village name is given on the far left of each row of four graphs). The parameters illustrated - klin: linear component of the mf aggregation parameter; c: strength of immunity to larval establishment; IC: strength of immunosuppression; ψ2 s2: referred to as the establishment rate, all of which are dimensionless except for c (see Additional File 1, Tables 1 and 2) - are those that showed a strong difference between the initially assigned uniform 'flat' priors and the obtained posteriors within a data set. Graph (a) shows results for Papua New Guinea villages; and (b): Tanzania and India villages.
Figure 3
Figure 3
Breakpoint and reproduction number estimates. Breakpoints versus threshold biting rates (TBRs; black scatter plots) and the estimated R0 (histograms) for the best-fitting parameter sets obtained from each of the data sets investigated in this study. Country and village names are given above each plot, along with annual biting rate values in parentheses.
Figure 4
Figure 4
Breakpoint comparisons across the two mosquito species. Histograms of the distribution of breakpoints, calculated for the accepted parameter sets and aggregated for data sets in which the vector is culicine or anopheline. The median breakpoint value for the culicine model fits is 0.23% microfilaria (mf) with 95% of values lying above 0.09% mf, whereas for anopheline models the median value is 0.75% with 95% of values lying above 0.12%.
Figure 5
Figure 5
Classification tree model showing the model parameters that differed significantly between the various study sites. The results show that differences in the infection aggregation parameter (k0), signifying how over dispersed infection among individuals in each community was (lower value higher the overdispersion), the acquired immunity parameter (c) and the establishment rate (ψ2s2), primarily underlay the variations observed in the parameter vector estimates obtained between the study communities investigated in this study. The cross-validated error rate of the displayed model (with eight splits) was low at approximately 1%. The classification tree was fit using the rpart package in R.
Figure 6
Figure 6
Extinction and re-emergence of infection following six rounds of mass drug administration. The effect of six annual mass drug administration (MDA) rounds on 500 accepted or passing parameter sets of the model fitted to baseline age-mf prevalence data of the Papua New Guinea village, Ngahmbule. The figure on the left (a) shows that the response to six MDAs is very similar in each realization, with the prevalence dropping to very low levels after the final treatment round. The figure on the right (b) zooms in on the region encircled by the light blue line; it shows that, following six treatments, only approximately half of the 500 trajectories are sufficiently reduced in mf prevalence to have dropped below the breakpoint and for the parasite to go to extinction.
Figure 7
Figure 7
Parasite extinction rates following six mass drug administration (MDA) rounds. Both graphs show the outcome of six MDA rounds at 80% coverage on the 500 passing parameter sets for each study community. Graph (a) shows the relationship between the proportion of the 500 accepted models that go to extinction - that is, the microfilaria prevalence drops below the breakpoint estimated for each individual accepted model, and the annual biting rate of the corresponding study community, while the graph (b) plots the same proportions of the models that go to extinction but in relation to the mean value of R0 for each community. Black crosses correspond to anopheline models and circles are culicine.

Similar articles

Cited by

References

    1. Sachs JD. The neglected tropical diseases. Sci Am. 2007;296:33A. doi: 10.1038/scientificamerican0107-33A. - DOI - PubMed
    1. Molyneux DH, Hotez PJ, Fenwick A. Rapid-impact interventions': how a policy of integrated control for Africa's neglected tropical diseases could benefit the poor. PLoS Med. 2005;2:e336. doi: 10.1371/journal.pmed.0020336. - DOI - PMC - PubMed
    1. Bockarie MJ, Pedersen EM, White GB, Michael E. Role of vector control in the global program to eliminate lymphatic filariasis. Annu Rev Entomol. 2009;54:469–87. doi: 10.1146/annurev.ento.54.110807.090626. - DOI - PubMed
    1. Yamey G, Hotez P. Neglected tropical diseases. BMJ. 2007;335:269–270. doi: 10.1136/bmj.39281.645035.80. - DOI - PMC - PubMed
    1. Sunish IP, Rajendran R, Mani TR, Munirathinam A, Tewari SC, Hiriyan J, Gajanana A, Satyanarayana K. Resurgence in filarial transmission after withdrawal of mass drug administration and the relationship between antigenaemia and microfilaraemia - a longitudinal study. Trop Med Int Health. 2002;7:59–69. doi: 10.1046/j.1365-3156.2002.00828.x. - DOI - PubMed

Publication types

MeSH terms