

Conserved developmental transcriptomes in evolutionarily divergent species
- PMID: 20236529
- PMCID: PMC2864575
- DOI: 10.1186/gb-2010-11-3-r35
Conserved developmental transcriptomes in evolutionarily divergent species
Abstract
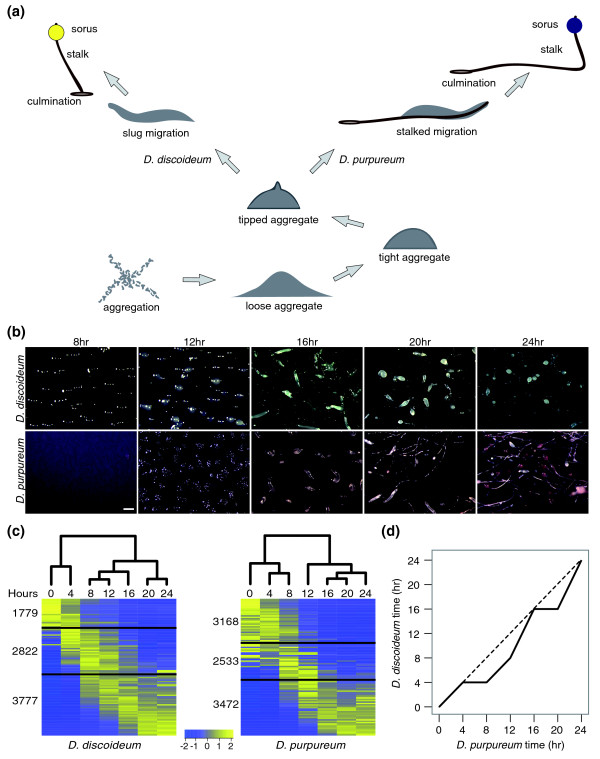
Background: Evolutionarily divergent organisms often share developmental anatomies despite vast differences between their genome sequences. The social amoebae Dictyostelium discoideum and Dictyostelium purpureum have similar developmental morphologies although their genomes are as divergent as those of man and jawed fish.
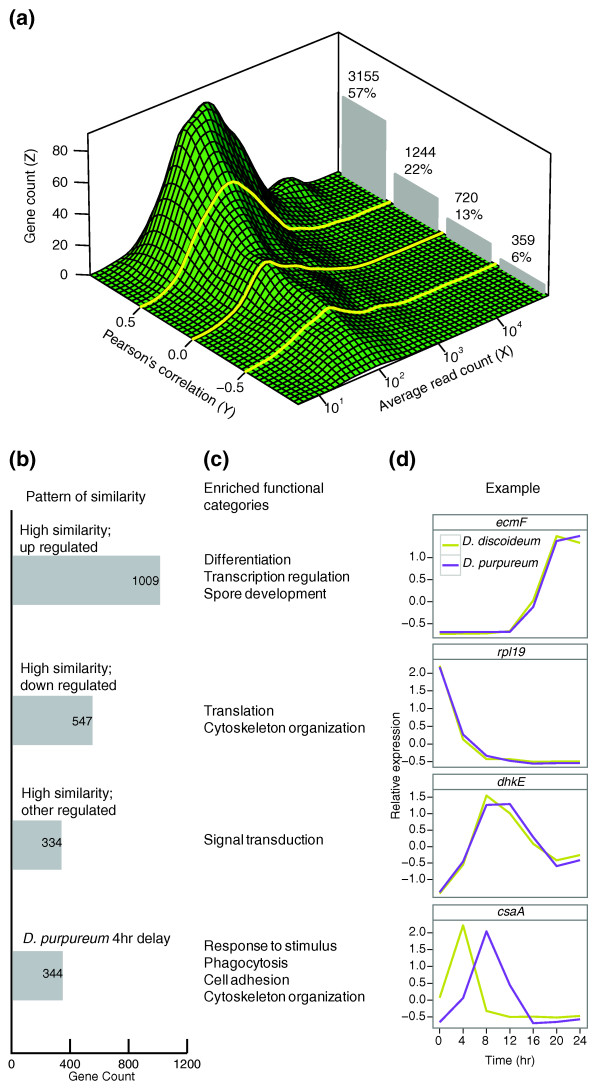
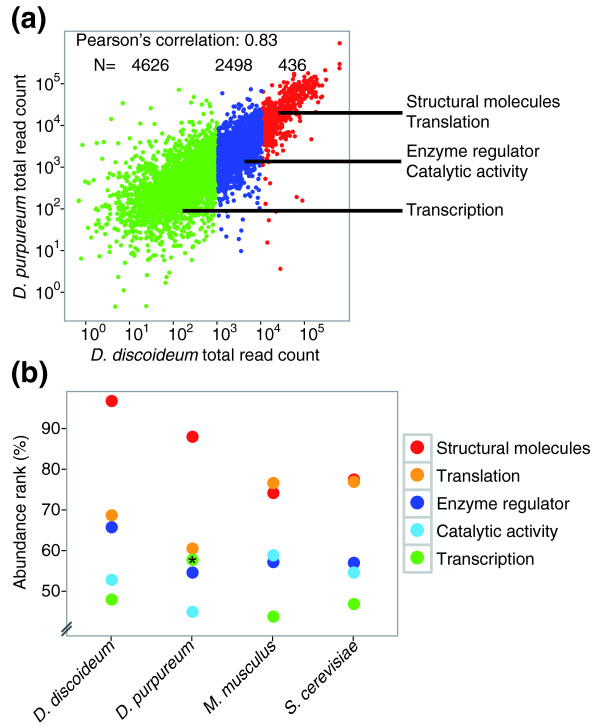
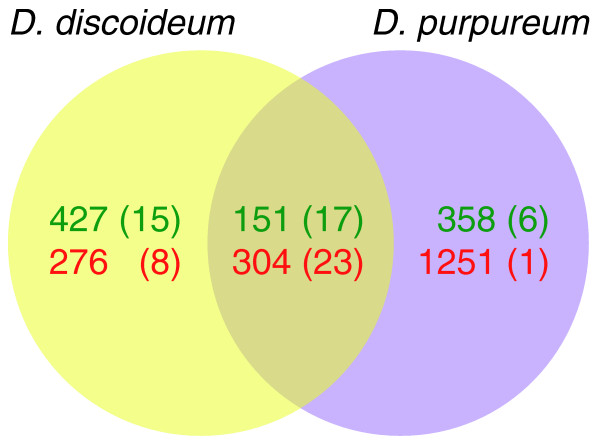
Results: Here we show that the anatomical similarities are accompanied by extensive transcriptome conservation. Using RNA sequencing we compared the abundance and developmental regulation of all the transcripts in the two species. In both species, most genes are developmentally regulated and the greatest expression changes occur during the transition from unicellularity to multicellularity. The developmental regulation of transcription is highly conserved between orthologs in the two species. In addition to timing of expression, the level of mRNA production is also conserved between orthologs and is consistent with the intuitive notion that transcript abundance correlates with the amount of protein required. Furthermore, the conservation of transcriptomes extends to cell-type specific expression.
Conclusions: These findings suggest that developmental programs are remarkably conserved at the transcriptome level, considering the great evolutionary distance between the genomes. Moreover, this transcriptional conservation may be responsible for the similar developmental anatomies of Dictyostelium discoideum and Dictyostelium purpureum.
Figures
Comment in
-
Two different genomes that produce the same result.Genome Biol. 2010;11(4):114. doi: 10.1186/gb-2010-11-4-114. Epub 2010 Apr 27. Genome Biol. 2010. PMID: 20423532 Free PMC article.
Similar articles
-
Comparative genomics of the social amoebae Dictyostelium discoideum and Dictyostelium purpureum.Genome Biol. 2011;12(2):R20. doi: 10.1186/gb-2011-12-2-r20. Epub 2011 Feb 28. Genome Biol. 2011. PMID: 21356102 Free PMC article.
-
Developmental changes in transcriptional profiles.Dev Growth Differ. 2011 May;53(4):567-75. doi: 10.1111/j.1440-169X.2010.01241.x. Epub 2011 Mar 30. Dev Growth Differ. 2011. PMID: 21447097 Review.
-
The Long Noncoding RNA Transcriptome of Dictyostelium discoideum Development.G3 (Bethesda). 2017 Feb 9;7(2):387-398. doi: 10.1534/g3.116.037150. G3 (Bethesda). 2017. PMID: 27932387 Free PMC article.
-
[Genetic network controlling cell differentiation in Dictyostelium].Tanpakushitsu Kakusan Koso. 2005 Dec;50(16 Suppl):2219-24. Tanpakushitsu Kakusan Koso. 2005. PMID: 16411454 Review. Japanese. No abstract available.
-
A set of genes conserved in sequence and expression traces back the establishment of multicellularity in social amoebae.BMC Genomics. 2016 Nov 4;17(1):871. doi: 10.1186/s12864-016-3223-z. BMC Genomics. 2016. PMID: 27814692 Free PMC article.
Cited by
-
Role of the Skp1 prolyl-hydroxylation/glycosylation pathway in oxygen dependent submerged development of Dictyostelium.BMC Dev Biol. 2012 Oct 25;12:31. doi: 10.1186/1471-213X-12-31. BMC Dev Biol. 2012. PMID: 23098648 Free PMC article.
-
Combinatorial cell-specific regulation of GSK3 directs cell differentiation and polarity in Dictyostelium.Development. 2011 Feb;138(3):421-30. doi: 10.1242/dev.055335. Development. 2011. PMID: 21205787 Free PMC article.
-
A retinoblastoma orthologue is required for the sensing of a chalone in Dictyostelium discoideum.Eukaryot Cell. 2014 Mar;13(3):376-82. doi: 10.1128/EC.00306-13. Epub 2014 Jan 3. Eukaryot Cell. 2014. PMID: 24390142 Free PMC article.
-
The analytical landscape of static and temporal dynamics in transcriptome data.Front Genet. 2014 Feb 20;5:35. doi: 10.3389/fgene.2014.00035. eCollection 2014. Front Genet. 2014. PMID: 24600473 Free PMC article. Review.
-
Cell substratum adhesion during early development of Dictyostelium discoideum.PLoS One. 2014 Sep 23;9(9):e106574. doi: 10.1371/journal.pone.0106574. eCollection 2014. PLoS One. 2014. PMID: 25247557 Free PMC article.
References
Publication types
MeSH terms
Substances
Grants and funding
LinkOut - more resources
Full Text Sources
Molecular Biology Databases
Research Materials
