. 2010 Apr;9(2):59-75.

Noninvasive monitoring of mRFP1- and mCherry-labeled oncolytic adenoviruses in an orthotopic breast cancer model by spectral imaging

Affiliations

Noninvasive monitoring of mRFP1- and mCherry-labeled oncolytic adenoviruses in an orthotopic breast cancer model by spectral imaging

Anton V Borovjagin et al. Mol Imaging. 2010 Apr.

Abstract

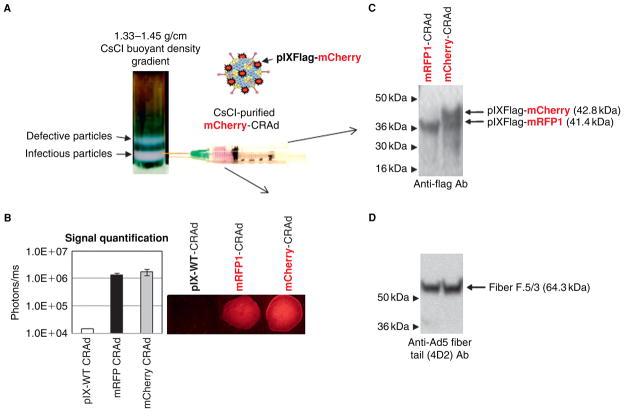
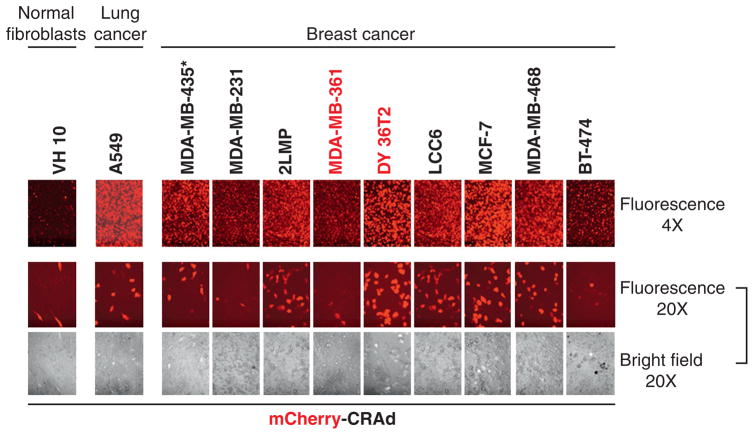
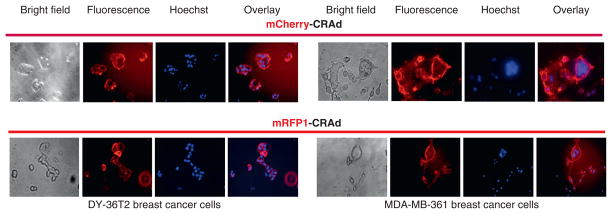
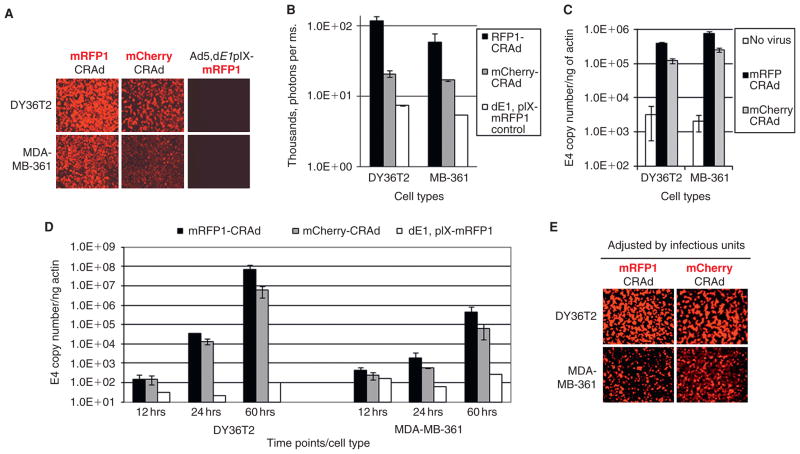
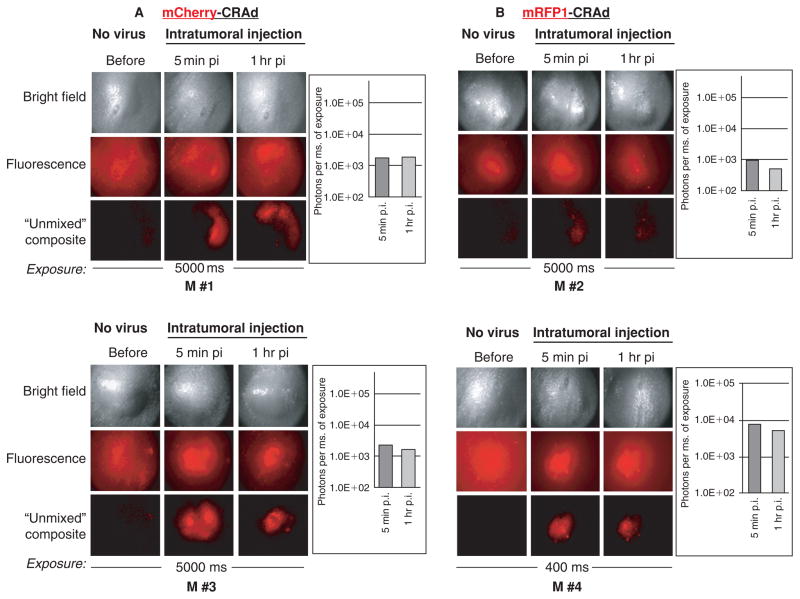
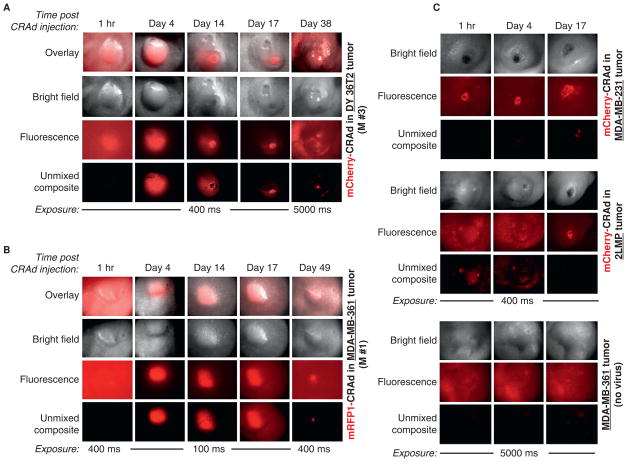
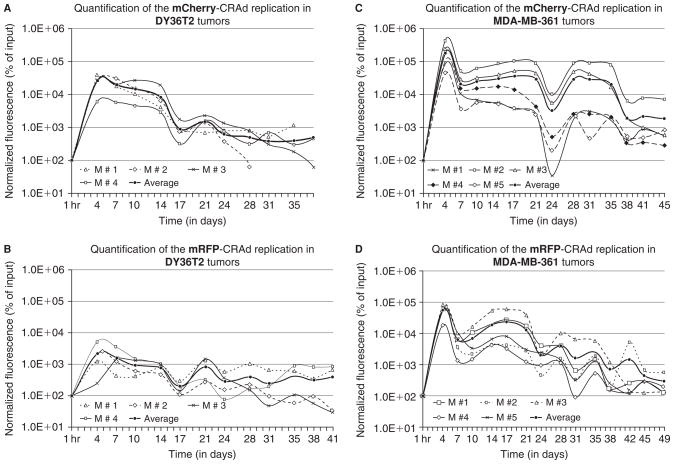
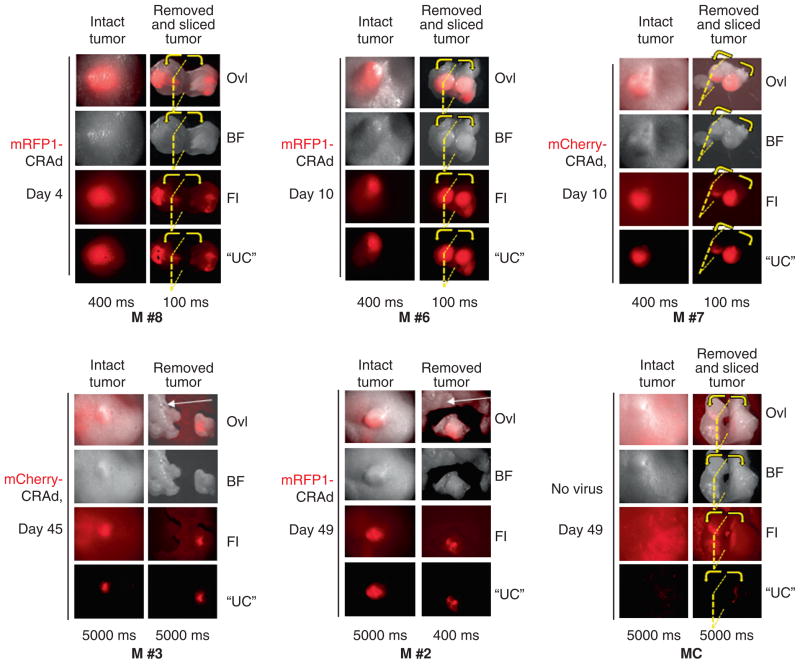
Genetic capsid labeling of conditionally replicative adenoviruses (CRAds) with fluorescent tags offers a potentially more accurate monitoring of those virotherapy agents in vivo. The capsid of an infectivity-enhanced CRAd, Ad5/3, delta 24, was genetically labeled with monomeric red fluorescent protein 1 (mRFP1) or its advanced derivative, "mCherry," to evaluate the utility of each red fluorescent reporter and the benefit of CRAd capsid labeling for noninvasive virus tracking in animal tumor models by a new spectral imaging approach. Either reporter was incorporated into the CRAd particles by genetic fusion to the viral capsid protein IX. Following intratumoral injection, localization and replication of each virus in orthotopic breast cancer xenografts were analyzed by spectral imaging and verified by quantitative polymerase chain reaction. Fluorescence in tumors increased up to 2,000-fold by day 4 and persisted for 5 to 7 weeks, showing oscillatory dynamics reflective of CRAd replication cycles. Capsid labeling in conjunction with spectral imaging thus enables direct visualization and quantification of CRAd particles in tumors prior to the reporter transgene expression. This allows for noninvasive control of CRAd delivery and distribution in tumors and facilitates quantitative assessment of viral replication. Although mCherry appeared to be superior to mRFP1 as an imaging tag, both reporters showed utility for CRAd imaging applications.


Figures

Figure 1
Figure 1
Molecular validation of CRAd capsid labeling. A, Capsid incorporation of mCherry-pIX fusion was evidenced by the color of the purified CRAd solution pooled from the CsCl gradient. A wild-type pIX-containing virus (pIX-WT-CRAd) was used as an unlabeled control. B, An equal number (1010) of purified viral particles of control (white bar), mRFP1- (black bar), and mCherry- (gray bar) CRAds were sampled on a glass slide and the red fluorescence was quantified by spectral imaging (bar chart). C, Incorporation of the pIX fusions with imaging reporters into the CRAd capsids was verified by Western blot using antiflag antibodies detecting a flag sequence at the C-terminus of pIX in the purified CRAd particles. Arrowheads indicate the positions of molecular-weight markers. D, The same blot (as C) was reprobed with the Ad5 fiber tail–specific antibodies (4D2) to confirm equal loading of each CRAd on the gel.
Figure 2
Figure 2
Susceptibility of various breast cancer cells to Ad5/3, delta24-pIX-mCherry virus infection in vitro. A panel of breast cancer cell lines were infected with Ad5/3, delta24-pIX-mCherry (mCherry-CRAd) particles at a multiplicity of infection of 1 TCID50/cell, and fluorescence was visualized 48 hours later by fluorescence microscopy at different magnifications using 4× or 20× objectives. Bright field and fluorescent images of the same views were taken in parallel to assess the early cytopathic effect of the replicating CRAd. Normal human fibroblasts VH-10 and lung carcinoma A549 cells were used as negative and positive controls for the cancer-selective virus replication, respectively. DY36T2 and MDA-MB-361 cell lines (highlighted in red) were chosen for implantation in mice to generate tumor xenografts. The asterisk indicates that the origin of the MDA-MB-435 cell line is highly controversial and was recently suggested to be a melanoma rather than a breast cancer line. However, the controversy has not been fully resolved.
Figure 3
Figure 3
Validation of biologic activity of labeled CRAd particles in vitro. DY36T2 and MDA-MB-361 cells were infected by mCherry- or mRFP1-CRAds at 4°C at the multiplicity of infection of 1.5 × 10⁴ vp/cell to block internalization but allow binding of labeled virions to their cognate (Ad3) receptors. Cell surface labeling by fluorescent viral particles was visualized 5 hours later by fluorescence microscopy (Fluorescence images). Prior to viral infection, cells were stained with Hoechst reagent for 10 minutes to label nuclear DNA with blue fluorescence (Hoechst images). Hoechst and fluorescence images were overlaid (Overlay images) using Photoshop C2 software. Bright field, fluorescence, and Hoechst images were obtained from the same view field by using the corresponding optical filters.
Figure 4
Figure 4
Biologic characterization of capsid-labeled CRAds in vitro by imaging and molecular methods. A, Fluorescence in DY36T2 and MDA-MB-361 cells was visualized by fluorescent microscopy (with 4× objective) 48 hours postinfection with either mCherry- or mRFP1-CRAd and incubation at 37°C. A capsid-labeled replication-defective virus Ad5, dE1, pIX-mRFP1 was used as a negative control for Ad replication. B, Quantification of fluorescence intensity in CRAd-infected cells from images shown on A by using Nuance 2.4.2 spectral imaging software. Fluorescent signals are presented as photons per millisecond (ms) of image exposure. C, Comparison of the labeled CRAds for their cell binding ability. An equal number of mRFP1- and mCherry-CRAd particles were used to infect either DY36T2 or MDA-MB-361 breast cancer cells in vitro for 1 hour at 4°C (multiplicity of infection [MOI] = 500 vp/cell). Total DNA was isolated from the cells for quantitative PCR analysis of the Ad5 genomic DNA (E4) copy number and the housekeeping β-actin gene for normalization. CRAd-infected cell samples were analyzed in triplicates. D, Comparison of the CRAd DNA replication in vitro. Each cell line was infected with an equal number of viral particles of either mRFP1- or mCherry-CRAds at an MOI of ≈100 vp/cell, and total DNA was harvested 12, 24, and 60 hours later. The rest of the analysis was the same as described for C. CRAd-infected cell samples were analyzed in triplicates. Black and gray bars correspond to mRFP1- and mCherry-CRAds, respectively. White bars correspond to replication-defective control virus dE1, pIX-mRFP1. Standard deviation is shown by brackets on all charts. All graphs are presented in log scale. E, Fluorescence microscopy analysis of intracellular fluorescence, similar to the one shown in A, except equal infectious units (TCID50 units) of each CRAd were used. Specifically, six times more viral particles of the mCherry-CRAd was used for infection to correlate infectious particles with produced cell fluorescence during the linear phase of CRAd replication in vitro. Images were taken between 48 and 60 hours postinfection.
Figure 5
Figure 5
Direct visualization of labeled viral particles in xenograft tumors. An equal number of purified viral particles (3 × 10¹⁰ vp in 10 μL of saline) of capsid-labeled mCherry-CRAd (A) or mRFP1-CRAd (B) were delivered into mammary fat pad tumors orthotopically implanted in athymic nude mice by a single intratumoral injection. Sample images of four representative tumors (M #1–M #4) are shown to reflect signal variability. Images were captured before and 5 minutes or 1 hour after injection of labeled viruses at 5,000 or 400 milliseconds (M #4) exposure. Signals on original unsaturated fluorescent images were quantified (bar graphs) using Nuance 2.4.2 spectral imaging software, as described in Materials and Methods. Unmixed composite images are the result of digital processing of the original (fluorescence) images by subtracting fluorescence components with spectral profiles, distinct from those of fluorescent proteins (mRFP1/mCherry). Bright field panels represent phase contrast images of the same tumors. Exposure times in milliseconds (ms) are indicated below each figure panel. M #1 to M #4 indicate names of the tumors/mice within each experimental tumor group, whose replication profiles are depicted in Figure 6. M #1 and M #3 belong to DY36T2 tumor groups; M #2 and M #4 belong to the MDA-MB-361 tumor groups; M #1 and M #3 received injection of the mCherry-CRAd; M #2 and M #4 were injected with the mRFP1-CRAd.
Figure 6
Figure 6
Noninvasive tracking of CRAd replication in tumors by spectral imaging. Arrays of images of representative mammary fat pad DY36T2 (A) or MDA-MB-361 (B) tumors showing dynamic changes in the tag-specific red fluorescence in the course of intratumoral replication of the labeled CRAds. Repetitive spectral imaging of the same tumors (corresponding to the M #3 and M #1 charts on Figure 7, A and D, respectively) was performed before (1 hour) and after (days 4–49) the onset of viral replication. All types of tumors received intratumoral injection of the same dosage (viral particles) of mCherry- (A, C) or mRFP1-CRAd (B). Overlay (bright field plus fluorescence) images were made by using Adobe Photoshop C2 software. Other details are as in Figure 5. C, Representative images of other types of breast cancer tumors MDA-MB-231 and 2LMP with a substantially lower permissiveness to the CRAd infection and weaker fluorescence (top and middle panels), following injection with the same dose of mCherry-CRAd as in A and B, at indicated time points. Representative images of a single MDA-MB-361 tumor that received no CRAd are shown as control for autofluorescence. Bright foci on original images represent autofluorescence of ulcerated (wounded) areas on the surface of some tumors.
Figure 7
Figure 7
Fluorescence intensity profiles of capsid-labeled CRAd replication in breast cancer xenografts. Fluorescence profiles were obtained for each tumor by plotting integrated density of each fluorescent signal measured at each indicated time point (days after injection) as a percentage of the input signal (fluorescence intensity of injected labeled particles 1 hour after injection) following normalization of signals for each time point, starting from day 4, to 109 infectious (TCID50) units of each CRAd. The “Average” curves represent mean values-based charts for each experimental group. Four mice/tumors were analyzed in experimental groups A and B (DY36T2 tumors) and five mice/tumors in groups C and D (MDA-MB361 tumors). Fluorescence signals were quantified as described in Materials and Methods.
Figure 8
Figure 8
Ex vivo analysis of isolated and sliced tumors by spectral imaging. Fluorescent signals in tumors were analyzed by spectral imaging before and after surgical removal and slicing of the tumors. Images taken noninvasively (“intact tumor”) are shown on the left-side columns of each image panel. Images of the same tumors after their surgical removal (panels M #2 and M #3) or both removal and slicing (panels M #6, M #7, M #8, MC) are shown on the right-side columns (“removed tumor” or “removed and sliced tumor”) for signal comparison. Images of six representative tumors (M #2, M #3, M #6, M #7, M #8, MC) surgically removed at different time points (day 4, day 10, and day 45/49) are displayed. Tumor cross-section plane is shown by a yellow dotted line, and the direction of the slice separation is indicated by yellow arrows. All shown tumors are of MDA-MB-361 cell origin. A tumor that did not receive any virus was used as autofluorescence control (panel “MC”). Exposure times in milliseconds are indicated below each image column. Shorter exposures are shown for cross-sections or some isolated tumor images (M #2) to avoid signal saturation. Tissues of nontumor origin shown for autofluorescence level comparison are indicated by white arrows (panels M #2 and M #3). BF = bright field images; Fl= fluorescence images; Ovl = overlay; “UC” = “unmixed composites”. Other details as in Figure 5 and Figure 6. Panels M #6, M #7, and M #8 display images of additional tumors of the MDA-MB-361 experimental groups dissected early in the experiment (day 4 or day 10 time point). Tumors M #2, M #6 and M #8 received mRFP1-CRAd; tumor M #3 and M #7 received mCherry-CRAd.

Similar articles

Cited by

References

    1. Nettelbeck DM. Virotherapeutics: conditionally replicative adenoviruses for viral oncolysis. Anticancer Drugs. 2003;14:577–84. - PubMed
    1. Makower D, Rozenblit A, Kaufman H, et al. Phase II clinical trial of intralesional administration of the oncolytic adenovirus ONYX-015 in patients with hepatobiliary tumors with correlative p53 studies. Clin Cancer Res. 2003;9:693–702. - PubMed
    1. Ahn M, Lee SJ, Li X, et al. Enhanced combined tumor-specific oncolysis and suicide gene therapy for prostate cancer using M6 promoter. Cancer Gene Ther. 2009;16:73–82. - PMC - PubMed
    1. Ranki T, Kanerva A, Ristimäki A, et al. A heparan sulfate-targeted conditionally replicative adenovirus, Ad5. pk7-Delta24, for the treatment of advanced breast cancer. Gene Ther. 2007;14:58–67. - PMC - PubMed
    1. de Martin R, Raidl M, Hofer E, et al. Adenovirus-mediated expression of green fluorescent protein. Gene Ther. 1997;4:493–5. - PubMed

Publication types

MeSH terms