

The role of ethylene and cold temperature in the regulation of the apple POLYGALACTURONASE1 gene and fruit softening
- PMID: 20237022
- PMCID: PMC2862417
- DOI: 10.1104/pp.109.151092
The role of ethylene and cold temperature in the regulation of the apple POLYGALACTURONASE1 gene and fruit softening
Abstract
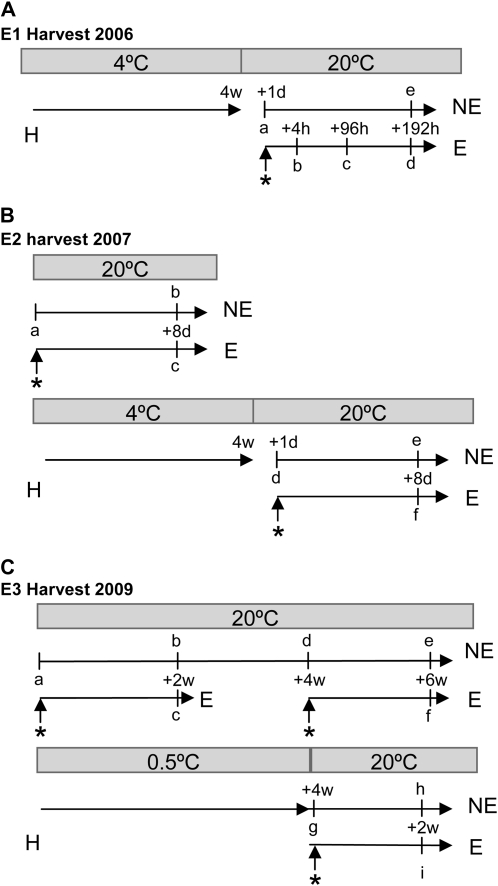
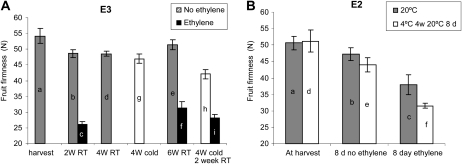
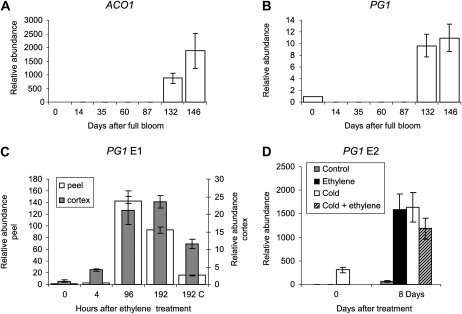
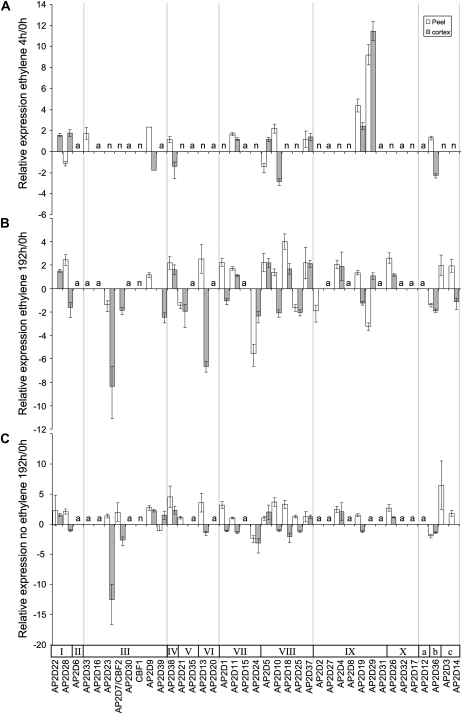
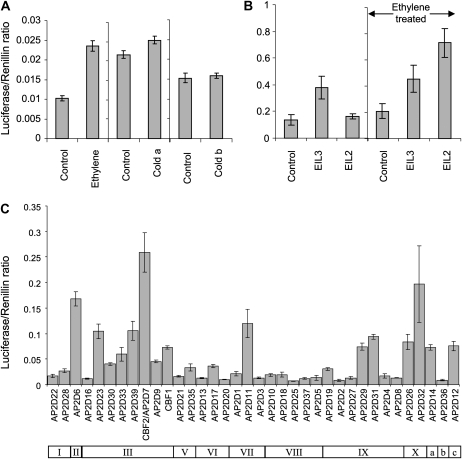
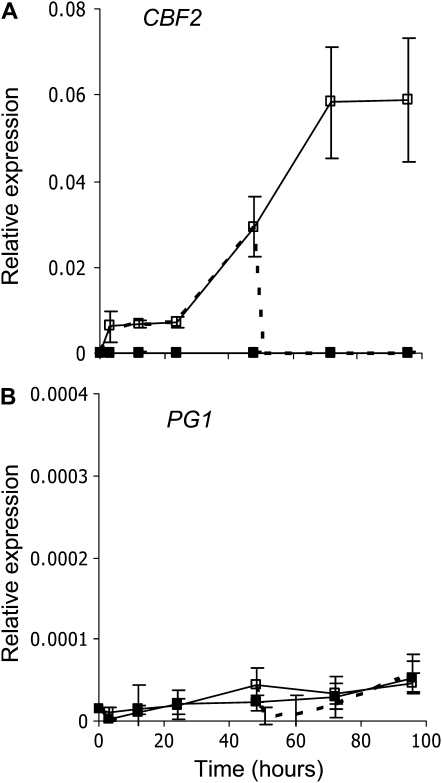
Fruit softening in apple (Malus x domestica) is associated with an increase in the ripening hormone ethylene. Here, we show that in cv Royal Gala apples that have the ethylene biosynthetic gene ACC OXIDASE1 suppressed, a cold treatment preconditions the apples to soften independently of added ethylene. When a cold treatment is followed by an ethylene treatment, a more rapid softening occurs than in apples that have not had a cold treatment. Apple fruit softening has been associated with the increase in the expression of cell wall hydrolase genes. One such gene, POLYGALACTURONASE1 (PG1), increases in expression both with ethylene and following a cold treatment. Transcriptional regulation of PG1 through the ethylene pathway is likely to be through an ETHYLENE-INSENSITIVE3-like transcription factor, which increases in expression during apple fruit development and transactivates the PG1 promoter in transient assays in the presence of ethylene. A cold-related gene that resembles a COLD BINDING FACTOR (CBF) class of gene also transactivates the PG1 promoter. The transactivation by the CBF-like gene is greatly enhanced by the addition of exogenous ethylene. These observations give a possible molecular mechanism for the cold- and ethylene-regulated control of fruit softening and suggest that either these two pathways act independently and synergistically with each other or cold enhances the ethylene response such that background levels of ethylene in the ethylene-suppressed apples is sufficient to induce fruit softening in apples.
Figures


Similar articles
-
EIL (ethylene-insensitive 3-like) transcription factors in apple affect both ethylene- and cold response-dependent fruit ripening.Plant J. 2025 Mar;121(5):e70059. doi: 10.1111/tpj.70059. Plant J. 2025. PMID: 40051338 Free PMC article.
-
QTL dynamics for fruit firmness and softening around an ethylene-dependent polygalacturonase gene in apple (Malus x domestica Borkh.).J Exp Bot. 2010 Jun;61(11):3029-39. doi: 10.1093/jxb/erq130. Epub 2010 May 12. J Exp Bot. 2010. PMID: 20462945 Free PMC article.
-
Ethylene regulates Apple (Malus x domestica) fruit softening through a dose x time-dependent mechanism and through differential sensitivities and dependencies of cell wall-modifying genes.Plant Cell Physiol. 2014 May;55(5):1005-16. doi: 10.1093/pcp/pcu034. Epub 2014 Feb 18. Plant Cell Physiol. 2014. PMID: 24553848
-
Insights into cell wall changes during fruit softening from transgenic and naturally occurring mutants.Plant Physiol. 2023 Jul 3;192(3):1671-1683. doi: 10.1093/plphys/kiad128. Plant Physiol. 2023. PMID: 36823689 Free PMC article. Review.
-
Flavor and Texture Characteristics of 'Fuji' and Related Apple (Malus domestica L.) Cultivars, Focusing on the Rich Watercore.Molecules. 2020 Mar 2;25(5):1114. doi: 10.3390/molecules25051114. Molecules. 2020. PMID: 32131548 Free PMC article. Review.
Cited by
-
Hypersensitive ethylene signaling and ZMdPG1 expression lead to fruit softening and dehiscence.PLoS One. 2013;8(3):e58745. doi: 10.1371/journal.pone.0058745. Epub 2013 Mar 20. PLoS One. 2013. PMID: 23527016 Free PMC article.
-
Ethylene and its crosstalk with hormonal pathways in fruit ripening: mechanisms, modulation, and commercial exploitation.Front Plant Sci. 2024 Nov 7;15:1475496. doi: 10.3389/fpls.2024.1475496. eCollection 2024. Front Plant Sci. 2024. PMID: 39574438 Free PMC article. Review.
-
Ethylene-responsive transcription factors interact with promoters of ADH and PDC involved in persimmon (Diospyros kaki) fruit de-astringency.J Exp Bot. 2012 Nov;63(18):6393-405. doi: 10.1093/jxb/ers296. Epub 2012 Oct 23. J Exp Bot. 2012. PMID: 23095993 Free PMC article.
-
Regulation of fleshy fruit ripening: From transcription factors to epigenetic modifications.Hortic Res. 2022 Feb 11;9:uhac013. doi: 10.1093/hr/uhac013. Online ahead of print. Hortic Res. 2022. PMID: 35147185 Free PMC article.
-
A Profusion of Molecular Scissors for Pectins: Classification, Expression, and Functions of Plant Polygalacturonases.Front Plant Sci. 2018 Aug 14;9:1208. doi: 10.3389/fpls.2018.01208. eCollection 2018. Front Plant Sci. 2018. PMID: 30154820 Free PMC article. Review.
References
-
- Alonso JM, Stepanova AN. (2004) The ethylene signaling pathway. Science 306: 1513–1515 - PubMed
-
- Atkinson RG, Bolitho KM, Wright MA, Iturriagagoitia-Bueno T, Reid SJ, Ross GS. (1998) Apple ACC-OXIDASE and POLYGALACTURONASE: ripening-specific gene expression and promoter analysis in transgenic tomato. Plant Mol Biol 38: 449–460 - PubMed
-
- Atkinson RG, Schaffer RJ, Gunaseelan K, Schroder R, inventors. September 1, 2008. Methods and compositions for increasing storage-life of fruit. New Zealand Patent No. NZ570886
Publication types
MeSH terms
Substances
LinkOut - more resources
Full Text Sources
Other Literature Sources
