

Physiological and proteomic characterization of manganese sensitivity and tolerance in rice (Oryza sativa) in comparison with barley (Hordeum vulgare)
- PMID: 20237113
- PMCID: PMC2887067
- DOI: 10.1093/aob/mcq046
Physiological and proteomic characterization of manganese sensitivity and tolerance in rice (Oryza sativa) in comparison with barley (Hordeum vulgare)
Abstract
Background and aims: Research on manganese (Mn) toxicity and tolerance indicates that Mn toxicity develops apoplastically through increased peroxidase activities mediated by phenolics and Mn, and Mn tolerance could be conferred by sequestration of Mn in inert cell compartments. This comparative study focuses on Mn-sensitive barley (Hordeum vulgare) and Mn-tolerant rice (Oryza sativa) as model organisms to unravel the mechanisms of Mn toxicity and/or tolerance in monocots.
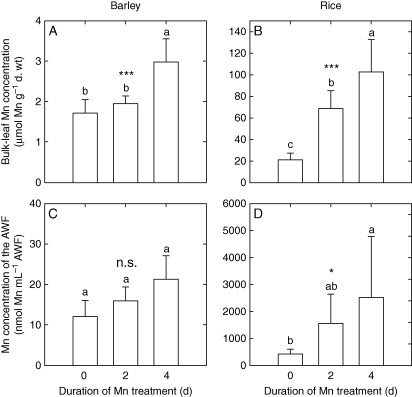
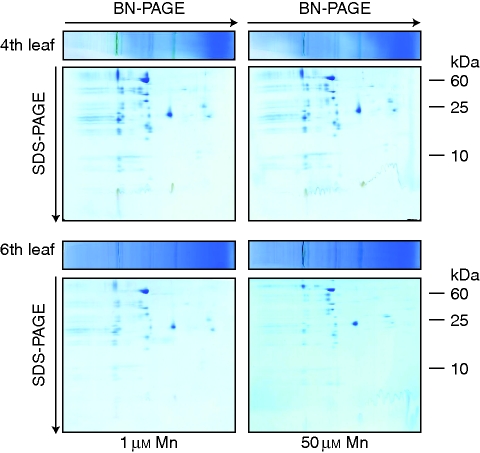
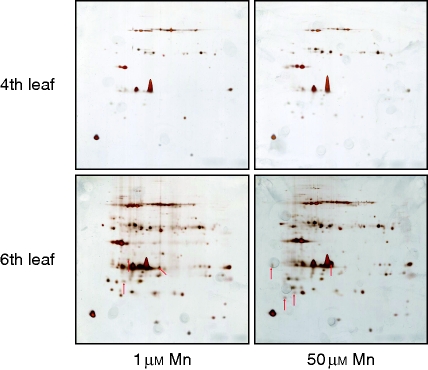
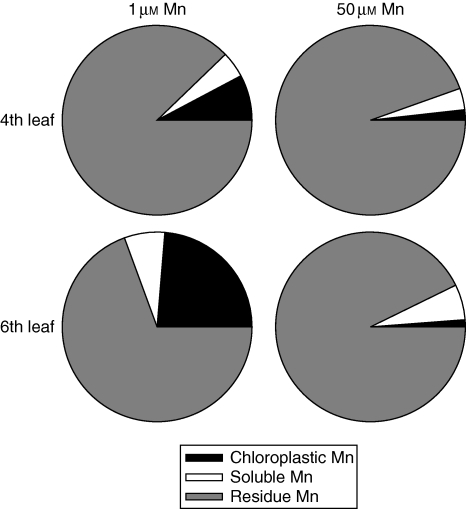
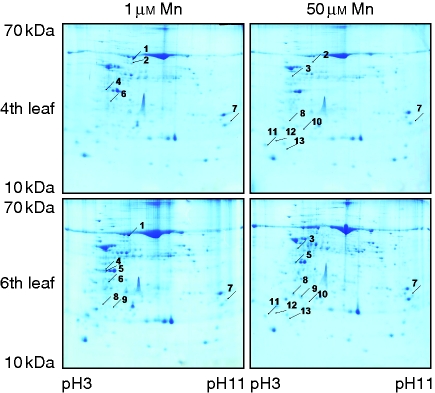
Methods: Bulk leaf Mn concentrations as well as peroxidase activities and protein concentrations were analysed in apoplastic washing fluid (AWF) in both species. In rice, Mn distribution between leaf compartments and the leaf proteome using 2D isoelectric focusing IEF/SDS-PAGE and 2D Blue native BN/SDS-PAGE was studied.
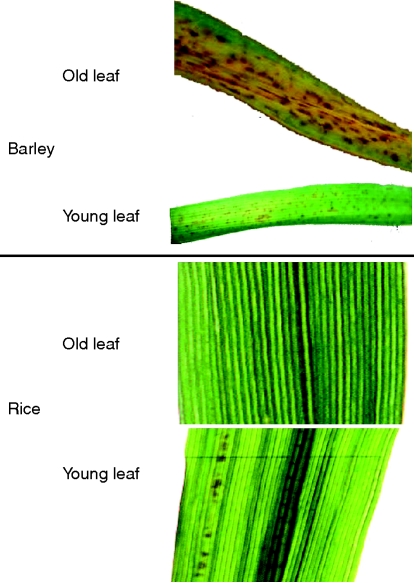
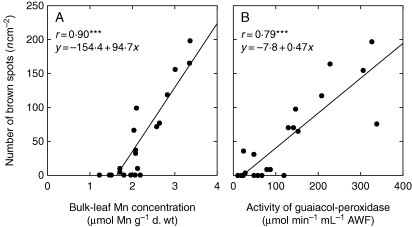
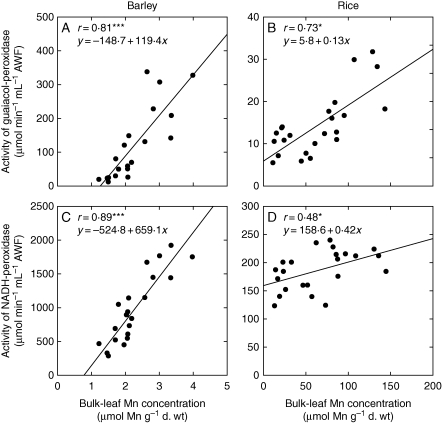
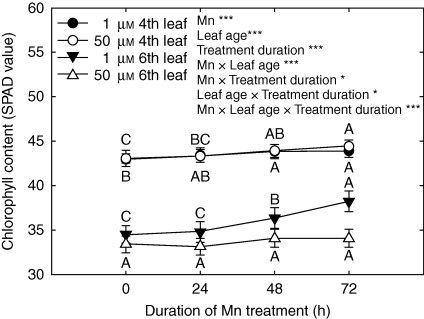
Key results: The Mn sensitivity of barley was confirmed since the formation of brown spots on older leaves was induced by low bulk leaf and AWF Mn concentrations and exhibited strongly enhanced H2O2-producing and consuming peroxidase activities. In contrast, by a factor of 50, higher Mn concentrations did not produce Mn toxicity symptoms on older leaves in rice. Peroxidase activities, lower by a factor of about 100 in the rice leaf AWF compared with barley, support the view of a central role for these peroxidases in the apoplastic expression of Mn toxicity. The high Mn tolerance of old rice leaves could be related to a high Mn binding capacity of the cell walls. Proteomic studies suggest that the lower Mn tolerance of young rice leaves could be related to Mn excess-induced displacement of Mg and Fe from essential metabolic functions.
Conclusions: The results provide evidence that Mn toxicity in barley involves apoplastic lesions mediated by peroxidases. The high Mn tolerance of old leaves of rice involves a high Mn binding capacity of the cell walls, whereas Mn toxicity in less Mn-tolerant young leaves is related to Mn-induced Mg and Fe deficiencies.
Figures
Similar articles
-
The role of hydrogen peroxide-producing and hydrogen peroxide-consuming peroxidases in the leaf apoplast of cowpea in manganese tolerance.Plant Physiol. 2006 Apr;140(4):1451-63. doi: 10.1104/pp.105.070474. Epub 2006 Feb 17. Plant Physiol. 2006. PMID: 16489137 Free PMC article.
-
Characterization of leaf apoplastic peroxidases and metabolites in Vigna unguiculata in response to toxic manganese supply and silicon.J Exp Bot. 2009;60(6):1663-78. doi: 10.1093/jxb/erp034. Epub 2009 Mar 13. J Exp Bot. 2009. PMID: 19286915 Free PMC article.
-
Combined metabolomic and transcriptomic analysis to reveal the response of rice to Mn toxicity stress.Ecotoxicol Environ Saf. 2025 Jan 1;289:117454. doi: 10.1016/j.ecoenv.2024.117454. Epub 2024 Dec 2. Ecotoxicol Environ Saf. 2025. PMID: 39626483
-
A member of cation diffusion facilitator family, MTP11, is required for manganese tolerance and high fertility in rice.Planta. 2018 Jul;248(1):231-241. doi: 10.1007/s00425-018-2890-1. Epub 2018 Apr 26. Planta. 2018. PMID: 29700611
-
Manganese phytotoxicity: new light on an old problem.Ann Bot. 2015 Sep;116(3):313-9. doi: 10.1093/aob/mcv111. Ann Bot. 2015. PMID: 26311708 Free PMC article. Review.
Cited by
-
Effect of elevated benzophenone-4 (BP4) concentration on Chlorella vulgaris growth and cellular metabolisms.Environ Sci Pollut Res Int. 2018 Nov;25(32):32549-32561. doi: 10.1007/s11356-018-3171-z. Epub 2018 Sep 21. Environ Sci Pollut Res Int. 2018. PMID: 30238265
-
Physiological responses and proteomic changes reveal insights into Stylosanthes response to manganese toxicity.BMC Plant Biol. 2019 May 22;19(1):212. doi: 10.1186/s12870-019-1822-y. BMC Plant Biol. 2019. PMID: 31113380 Free PMC article.
-
Metal species involved in long distance metal transport in plants.Front Plant Sci. 2014 Mar 25;5:105. doi: 10.3389/fpls.2014.00105. eCollection 2014. Front Plant Sci. 2014. PMID: 24723928 Free PMC article. Review.
-
OsYSL6 is involved in the detoxification of excess manganese in rice.Plant Physiol. 2011 Dec;157(4):1832-40. doi: 10.1104/pp.111.186031. Epub 2011 Oct 10. Plant Physiol. 2011. PMID: 21969384 Free PMC article.
-
Effects of Excess Manganese on the Xylem Sap Protein Profile of Tomato (Solanum lycopersicum) as Revealed by Shotgun Proteomic Analysis.Int J Mol Sci. 2020 Nov 23;21(22):8863. doi: 10.3390/ijms21228863. Int J Mol Sci. 2020. PMID: 33238539 Free PMC article.
References
-
- Bergmeyer HU, Bernt E. Malate dehydrogenase. In: Bergmeyer HU, editor. Methoden der enzymatischen Analyse. Band I. Weinheim: Verlag Chemie; 1974. pp. 649–653.
-
- Bovy A, De Vrieze G, Lugones L, et al. Iron-dependent stability of the ferredoxin I transcripts from the cyanobacterial strains Synechococcus species PCC 7942 and Anabaena species PCC 7937. Molecular Microbiology. 1993;7:429–439. - PubMed
-
- Bradford MM. A rapid and sensitive method for quantitation of microgram quantities of protein utilizing the principle of protein–dye binding. Analytical Biochemistry. 1976;72:248–254. - PubMed
-
- Burnell JN. The biochemistry of manganese in plants. In: Webb MJ, Nable RO, Graham RD, Hannam RJ, editors. Manganese in soil and plants. Dodrecht: Kluwer Academic Publishers; 1988. pp. 125–137.
