. 2010 Jun;298(6):C1376-87.
doi: 10.1152/ajpcell.00408.2009. Epub 2010 Mar 17.

Extracellular signal-regulated kinase and GEF-H1 mediate depolarization-induced Rho activation and paracellular permeability increase

Affiliations

Extracellular signal-regulated kinase and GEF-H1 mediate depolarization-induced Rho activation and paracellular permeability increase

Faiza Waheed et al. Am J Physiol Cell Physiol. 2010 Jun.

Abstract

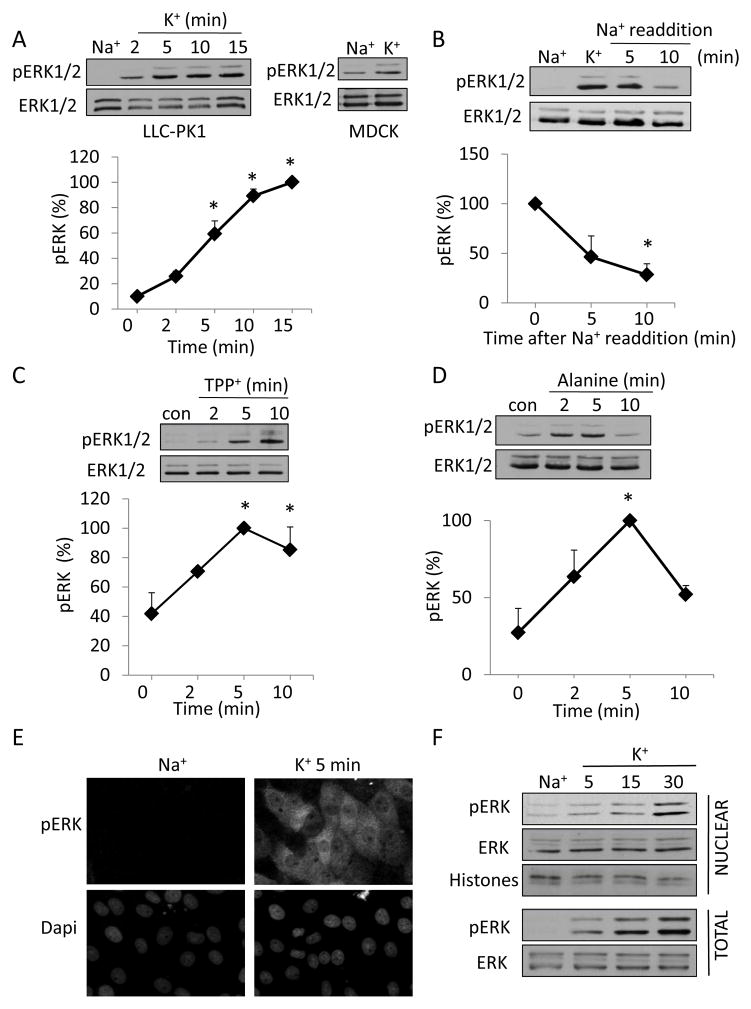
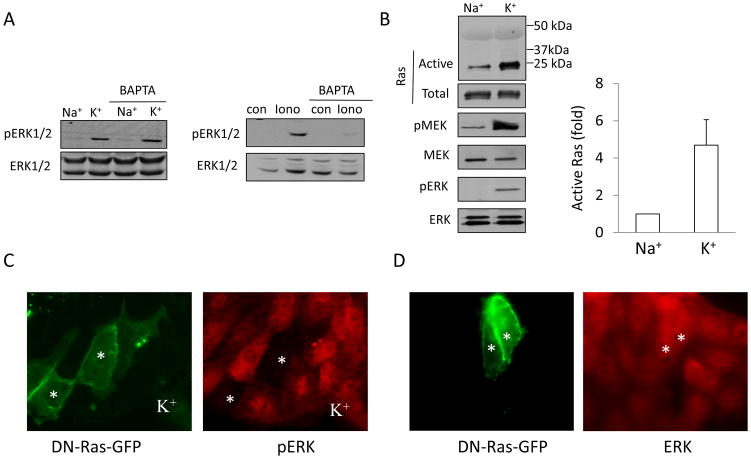
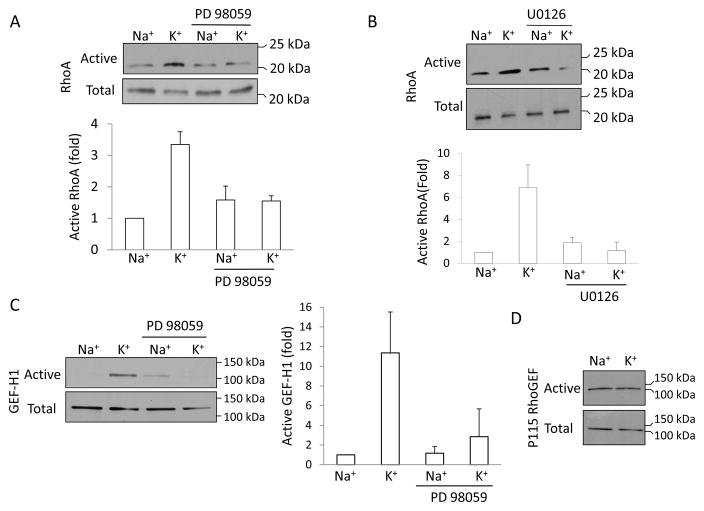
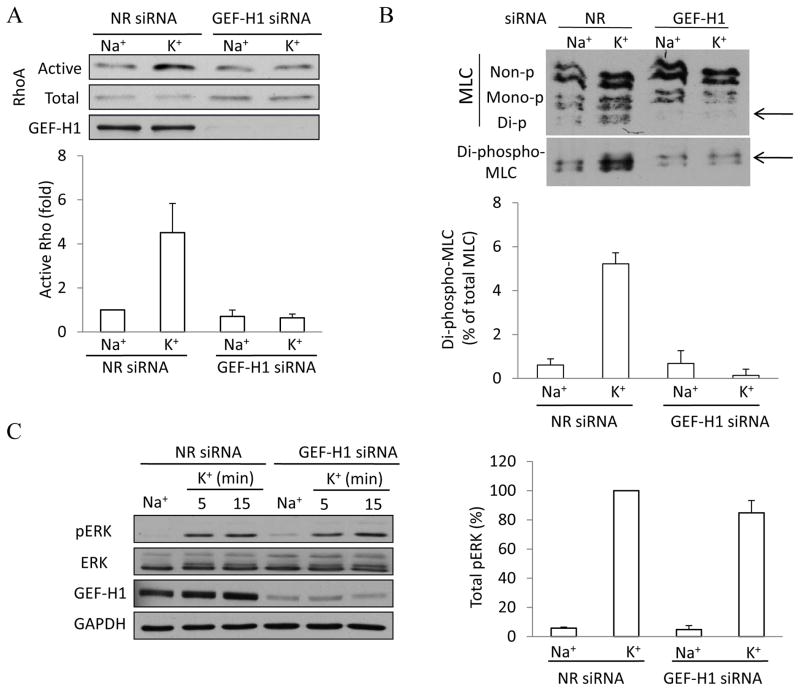
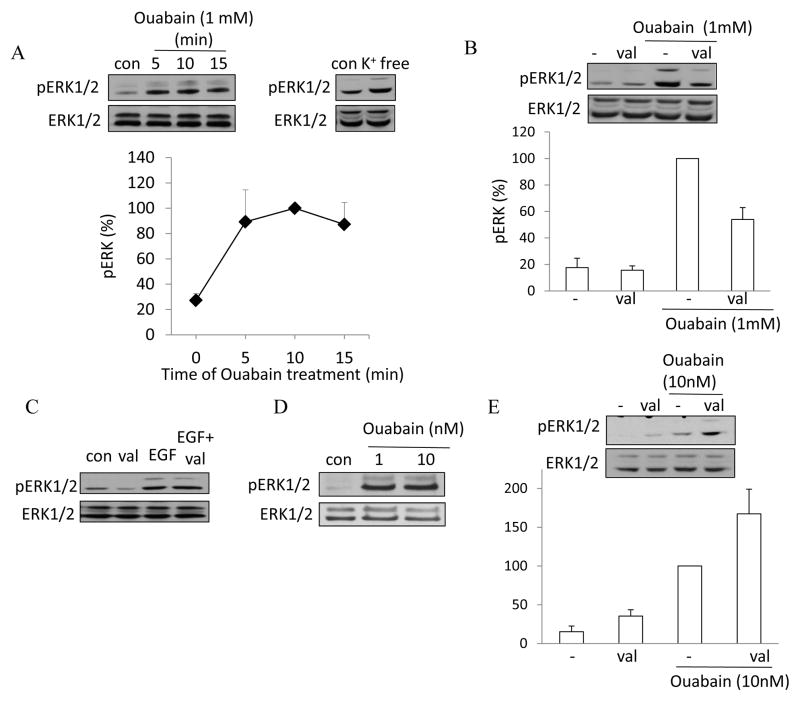
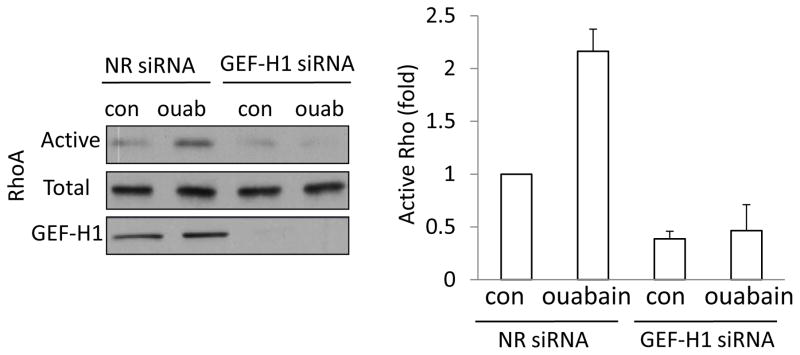
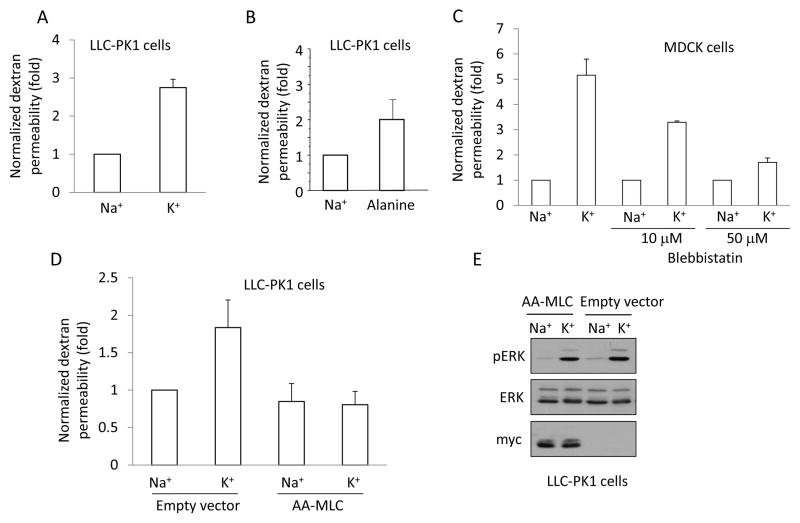
Plasma membrane depolarization activates the Rho/Rho kinase (ROK) pathway and thereby enhances myosin light chain (MLC) phosphorylation, which in turn is thought to be a key regulator of paracellular permeability. However, the upstream mechanisms that couple depolarization to Rho activation and permeability changes are unknown. Here we show that three different depolarizing stimuli (high extracellular K(+) concentration, the lipophilic cation tetraphenylphosphonium, or l-alanine, which is taken up by electrogenic Na(+) cotransport) all provoke robust phosphorylation of ERK in LLC-PK1 and Madin-Darby canine kidney (MDCK) cells. Importantly, inhibition of ERK prevented the depolarization-induced activation of Rho. Searching for the underlying mechanism, we have identified the GTP/GDP exchange factor GEF-H1 as the ERK-regulated critical exchange factor responsible for the depolarization-induced Rho activation. This conclusion is based on our findings that 1) depolarization activated GEF-H1 but not p115RhoGEF, 2) short interfering RNA-mediated GEF-H1 silencing eliminated the activation of the Rho pathway, and 3) ERK inhibition prevented the activation of GEF-H1. Moreover, we found that the Na(+)-K(+) pump inhibitor ouabain also caused ERK, GEF-H1, and Rho activation, partially due to its depolarizing effect. Regarding the functional consequences of this newly identified pathway, we found that depolarization increased paracellular permeability in LLC-PK1 and MDCK cells and that this effect was mitigated by inhibiting myosin using blebbistatin or a dominant negative (phosphorylation incompetent) MLC. Taken together, we propose that the ERK/GEF-H1/Rho/ROK/pMLC pathway could be a central mechanism whereby electrogenic transmembrane transport processes control myosin phosphorylation and regulate paracellular transport in the tubular epithelium.


Figures

Figure 1
Figure 1. Plasma membrane depolarization induces ERK phosphorylation in epithelial cells
LLC-PK1 (A–D) or MDCK (A) cells grown to confluence were serum-deprived for 3 h and preincubated in Na+-medium for 15 min. In A and B the cells were treated with Na+ or K+ -medium for the indicated times (A) or 10 minutes (B). In B, following the treatment with K+-medium, the Na+-medium was added back for the indicated times. In C and D the cells were exposed to 0.5 mM TPP+ (C) or 20 mM L-Alanine (D). At the end of the treatments, the cells were lysed and total and phosphorylated ERK was detected using Western blotting as described in Materials and Methods. The graphs represent densitometric quantification of pERK Western blots. The values are expressed as the % of the maximal effect, taken as 100%. Data are mean± S.E. (n≥3). Where error bars are not visible, they are smaller than the symbol. For all panels, * indicates significance vs. 0 min (p<0.05). E,F. Depolarization-induced ERK phosphorylation occurs both in the cytosol and the nucleus. E. Confluent LLC-PK1 layers, grown on coverslips, were incubated with Na+ or K+ -medium for 5 minutes. The cells were fixed and pERK was visualized by immunofluorescence as described in Materials and Methods. Nuclei were visualized using Dapi. F. LLC-PK1 cells were grown on 6-cm dishes. Following treatment with Na+ - or K+ -medium for the indicated times, the cells were lysed and nuclear fractions were isolated as described in Materials and Methods. The presence of pERK and total ERK in samples containing 10 μg protein was tested using Western blotting. An antibody detecting histones was used to shown equal loading in the nuclear fractions.
Figure 2
Figure 2
A. Depolarization-induced ERK activation is Ca2+-independent Cells were preincubated with 30 μM BAPTA-AM in Na+- medium for 15 minutes prior to exposing them for 5 minutes to Na+ or K+-medium (left blots) or 1 μM ionomycin (Iono) (right blots). ERK phosphorylation was detected as in Fig 1. B. Ras is activated by depolarization. Cells grown on 10 cm dishes were incubated with Na+ or K+-medium for 5 minutes. The cells were lysed and the amount of active Ras was determined using the GST-Ras Binding Domain of c-Raf. Precipitated (active) Ras was detected by Western blotting (top blot). The total cell lysates from the same experiment were also probed with antibodies against Ras, phospho-MEK1/2 (pMEK), total MEK1/2 (MEK), phospho-ERK1/2 (pERK) and total ERK1/2 (ERK). The amount of precipitated (active) Ras was quantified by densitometry and normalized to the amount of total Ras in the cell lysate of the same sample. The results in each experiment were expressed as fold increase compared to the values obtained in control cells. The graph shows mean ± S.E. from n=3 independent experiments. C. Ras mediates ERK activation. Cells were transfected with dominant negative K-Ras coupled to GFP (DN-Ras-GFP). Forty-eight hours later the cells were treated with K+-medium for 30 minutes and pERK was visualized as in A. The images show DN-Ras-GFP and pERK in the same field. The transfected cells are labeled with asterisks. Note, that while pERK is well detectable in non-transfected cells, the presence of DN-Ras prevents the induction of ERK phosphorylation. D. DN- Ras does not affect total ERK levels. Cells were transfected with DN-Ras-GFP as in C. Forty-eight hours after transfection the cells were fixed and ERK was detected by immunostaining. The transfected cells are labeled with asterisks.
Figure 3
Figure 3. Role of ERK in depolarization-induced activation of GEF-H1 and Rho. A and B
LLC-PK1 cells were treated with 10 μM PD98059 (A) or 10 μM U0126 (B) for 15 min in the Na+-medium, as indicated, followed by incubation in Na+or K+-medium for 5 minutes. The amount of active RhoA was determined using a Rhotekin GST-RBD precipitation assay. RhoA in the precipitates (active RhoA) and total cell lysates (total RhoA) was detected by Western blotting using a RhoA antibody. C and D. Active GEF-H1 or p115RhoGEF was precipitated using the GST-RhoG17A. Precipitated (active) and total GEF-H1 (C) or p115RhoGEF (D) was detected by Western blot. The Rho and GEF-H1 blots were quantified by densitometry. The amount of active Rho or GEF-H1 in each sample was normalized to the amount of total RhoA or GEF-H1 in the corresponding cell lysates. The results in each experiment were expressed as fold increase compared to the values obtained in control cells. The graphs show mean ± S.E. from n=3 independent experiments.
Figure 4
Figure 4. GEF-H1 downregulation prevents depolarization-induced activation of the Rho pathway
LLC-PK1 cells were transfected with non-related (NR) siRNA or an siRNA designed against porcine GEF-H1. Forty-eight hours after transfection cells were treated with Na+ or K+ -medium for 5 minutes. A. Rho activation was measured and quantified as in Figure 3. GEF-H1 was also detected in the total cell lysates. The graph shows quantification of Rho activation in n=3 independent experiments (mean ± S.E.). B. Myosin light chain phosphorylation was detected by Urea-glycerol PAGE as described in Materials and Methods. The blot was developed with an antibody against total MLC, followed by redeveloping with a di-phospho-MLC antibody. LLC-PK1 cells contain two isoforms of MLC, and each can exist as a non-, mono- or di-phosphorylated form as labeled (57). The arrow points to di-phospho-MLC. The graph summarizes densitometric quantification of the changes in di-phospho-MLC. The amount of di-phospho-MLC was expressed as the percentage of the total MLC of the same sample. The results were then expressed as the fold increase compared to the values obtained in control cells (taken as 1). The data represent mean ± S.E. for n=3 independent experiments. C. GEF-H1 downregulation does not affect depolarization-induced ERK phosphorylation. Cells were transfected with NR or GEF-H1 siRNA as above, treated as indicated and ERK and pERK were detected as in Fig 1. An antibody against GAPDH was used to verify equal protein loading. The blots of total cell lysates were also developed with a GEF-H1 antibody to verify downregulation. The blots were analyzed using densitometry as in Fig 1. The graphs represent n=3 independent experiments.
Figure 5
Figure 5. Inhibition of the Na+/K+ pump by ouabain induces ERK activation partly through depolarization
LLC-PK1 cells were subjected to the following treatments: the indicated concentration of ouabain added into the Na+-medium for the indicated times (A) or 5 minutes (C, D and E); K+-free medium for 5 minutes (A); 10 μg/ml valinomycin with or without ouabain (B and E) or 10 ng/ml EGF for 5 minutes (C). Where valinomycin was used (B, C and E), the Na+-medium contained 10 mM K+. ERK phosphorylation was detected and quantified as in Fig 1. All graphs show data from n=3 experiments (mean ± S.E.).
Figure 6
Figure 6. Ouabain activates Rho through GEF-H1
Cells were transfected with a non-related (NR) or GEF-H1 specific siRNA. Cells were treated with 1 mM ouabain in Na+-medium, and Rho activation was determined and quantified as in Figure 3. All graphs show data from n=3 experiments (mean± S.E.).
Figure 7
Figure 7. Depolarization elevates paracellular permeability in a pMLC-dependent manner
A–D. LLC-PK1 (A, B) or MDCK (C) or AA-MLC expressing LLC-PK1 cells (D) were grown to confluence on Costar Transwell filters. The medium in both the top and bottom compartments was replaced by Na+- or K+-medium and the cells were exposed to 2 mg/ml FITC-labelled dextran (4 kDa) added apically. FITC fluorescence was measured in samples taken from the bottom compartment after 3 hours. The fluorescence values obtained in the triplicate measurements of each experiment were averaged and normalized to the control. The following treatments were used as indicated: Na+ or K+ -medium (A,C, D); 20 mM alanine in Na+-medium (B); 10 or 50 μM blebbistatin pretreatment in Na+ medium for 30 minutes followed by Na+- or K+-medium supplemented with blebbistatin (C). The graphs show the mean ± S.E. from n≥3 experiments. E. Depolarization induced similar ERK phosphorylation in AA-MLC and control cells. Empty vector- or AA-MLC-transfected LLC-PK1 cells were treated with Na+- or K+-medium for 5 minutes. The cells were lysed and pERK, ERK and myc-tagged AA-MLC were detected by Western blotting.

Similar articles

Cited by

References

    1. Aittaleb M, Boguth CA, Tesmer JJ. Structure and function of heterotrimeric G protein-regulated Rho guanine nucleotide exchange factors. Mol Pharmacol. 2010;77:111–125. - PMC - PubMed
    1. Ark M, Kubat H, Beydagi H, Ergenoglu T, Songu-Mize E. Involvement of rho kinase in the ouabain-induced contractions of the rat renal arteries. Biochem Biophys Res Commun. 2006;340:417–421. - PubMed
    1. Arya R, Mallik M, Lakhotia SC. Heat shock genes - integrating cell survival and death. J Biosci. 2007;32:595–610. - PubMed
    1. Baldassa S, Zippel R, Sturani E. Depolarization-induced signaling to Ras, Rap1 and MAPKs in cortical neurons. Brain Res Mol Brain Res. 2003;119:111–122. - PubMed
    1. Balestrino M. Pathophysiology of anoxic depolarization: new findings and a working hypothesis. J Neurosci Methods. 1995;59:99–103. - PubMed

Publication types

MeSH terms

Substances

Grants and funding