

Recovery of sensorimotor function after experimental stroke correlates with restoration of resting-state interhemispheric functional connectivity
- PMID: 20237267
- PMCID: PMC6632290
- DOI: 10.1523/JNEUROSCI.5709-09.2010
Recovery of sensorimotor function after experimental stroke correlates with restoration of resting-state interhemispheric functional connectivity
Abstract
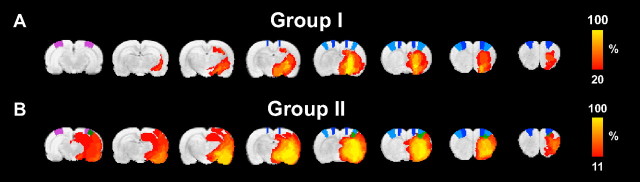
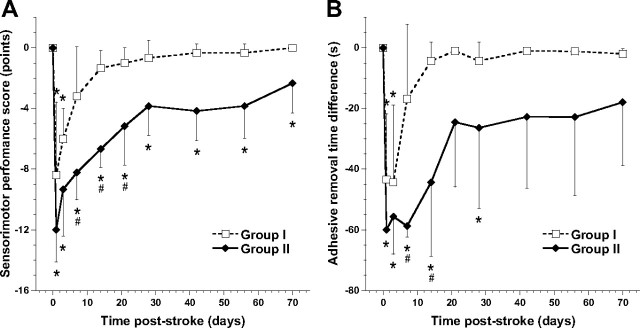
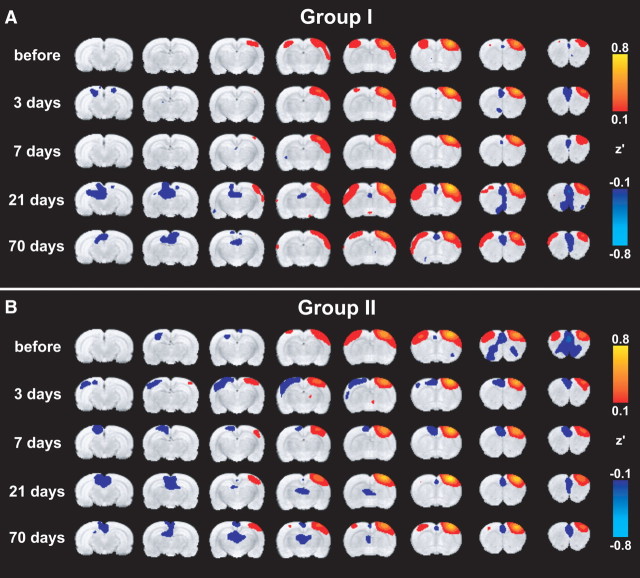
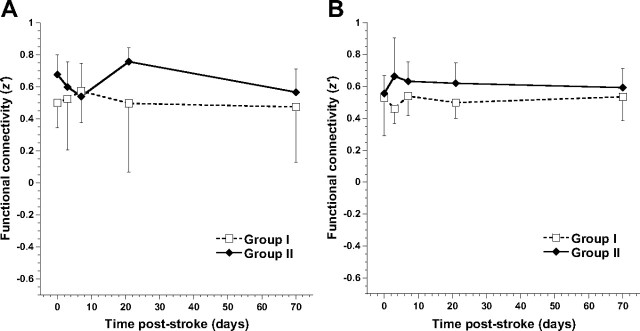
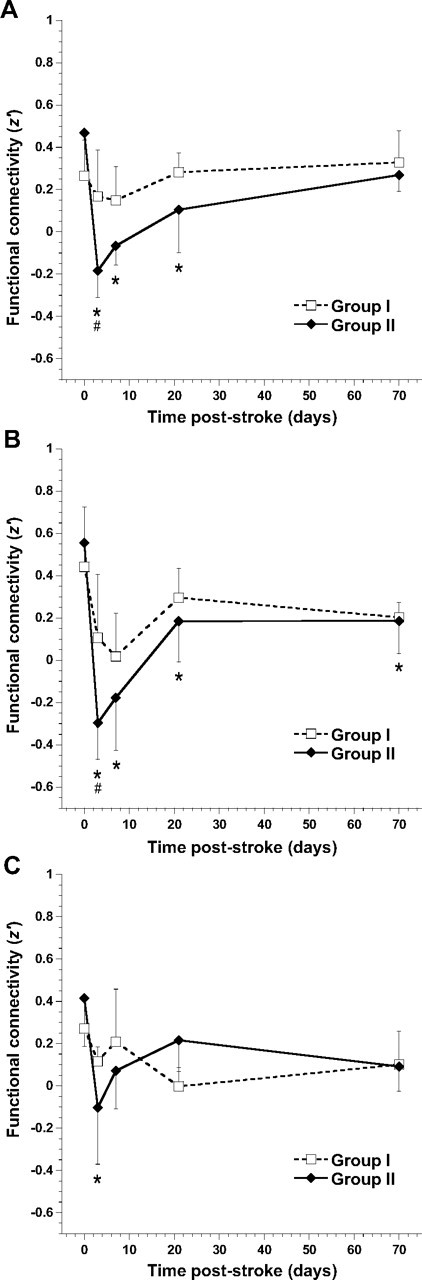
Despite the success of functional imaging to map changes in brain activation patterns after stroke, spatiotemporal dynamics of cerebral reorganization in correlation with behavioral recovery remain incompletely characterized. Here, we applied resting-state functional magnetic resonance imaging (rs-fMRI) together with behavioral testing to longitudinally assess functional connectivity within neuronal networks, in relation to changes in associated function after unilateral stroke in rats. Our specific goals were (1) to identify temporal alterations in functional connectivity within the bilateral cortical sensorimotor system and (2) to elucidate the relationship between those alterations and changes in sensorimotor function. Our study revealed considerable loss of functional connectivity between ipsilesional and contralesional primary sensorimotor cortex regions, alongside significant sensorimotor function deficits in the first days after stroke. The interhemispheric functional connectivity restored in the following weeks, but remained significantly reduced up to 10 weeks after stroke in animals with lesions that comprised subcortical and cortical tissue, whereas transcallosal neuroanatomical connections were preserved. Intrahemispheric functional connectivity between primary somatosensory and motor cortex areas was preserved in the lesion border zone and moderately enhanced contralesionally. The temporal pattern of changes in functional connectivity between bilateral primary motor and somatosensory cortices correlated significantly with the evolution of sensorimotor function scores. Our study (1) demonstrates that poststroke loss and recovery of sensorimotor function is associated with acute deterioration and subsequent retrieval of interhemispheric functional connectivity within the sensorimotor system and (2) underscores the potential of rs-fMRI to assess spatiotemporal characteristics of functional brain reorganization that may underlie behavioral recovery after brain injury.
Figures
Similar articles
-
Changes in resting-state functional connectivity after stroke in a mouse brain lacking extracellular matrix components.Neurobiol Dis. 2018 Apr;112:91-105. doi: 10.1016/j.nbd.2018.01.011. Epub 2018 Jan 31. Neurobiol Dis. 2018. PMID: 29367009 Free PMC article.
-
Multisensory stimulation improves functional recovery and resting-state functional connectivity in the mouse brain after stroke.Neuroimage Clin. 2017 Dec 2;17:717-730. doi: 10.1016/j.nicl.2017.11.022. eCollection 2018. Neuroimage Clin. 2017. PMID: 29264113 Free PMC article.
-
Correspondence between altered functional and structural connectivity in the contralesional sensorimotor cortex after unilateral stroke in rats: a combined resting-state functional MRI and manganese-enhanced MRI study.J Cereb Blood Flow Metab. 2010 Oct;30(10):1707-11. doi: 10.1038/jcbfm.2010.124. Epub 2010 Jul 28. J Cereb Blood Flow Metab. 2010. PMID: 20664609 Free PMC article.
-
Integrated technology for evaluation of brain function and neural plasticity.Phys Med Rehabil Clin N Am. 2004 Feb;15(1):263-306. doi: 10.1016/s1047-9651(03)00124-4. Phys Med Rehabil Clin N Am. 2004. PMID: 15029909 Review.
-
Network Reorganization for Neurophysiological and Behavioral Recovery Following Stroke.Cent Nerv Syst Agents Med Chem. 2024;24(2):117-128. doi: 10.2174/0118715249277597231226064144. Cent Nerv Syst Agents Med Chem. 2024. PMID: 38299298 Review.
Cited by
-
Transcranial direct current stimulation in stroke rehabilitation: a review of recent advancements.Stroke Res Treat. 2013;2013:170256. doi: 10.1155/2013/170256. Epub 2013 Feb 27. Stroke Res Treat. 2013. PMID: 23533955 Free PMC article.
-
Sensorimotor, Attentional, and Neuroanatomical Predictors of Upper Limb Motor Deficits and Rehabilitation Outcome after Stroke.Neural Plast. 2021 Apr 1;2021:8845685. doi: 10.1155/2021/8845685. eCollection 2021. Neural Plast. 2021. PMID: 33868400 Free PMC article.
-
White matter integrity of premotor-motor connections is associated with motor output in chronic stroke patients.Neuroimage Clin. 2014 Nov 18;7:82-6. doi: 10.1016/j.nicl.2014.11.006. eCollection 2015. Neuroimage Clin. 2014. PMID: 25610769 Free PMC article.
-
The Role of Extra-motor Networks in Upper Limb Motor Performance Post-stroke.Neuroscience. 2023 Mar 15;514:1-13. doi: 10.1016/j.neuroscience.2023.01.033. Epub 2023 Feb 1. Neuroscience. 2023. PMID: 36736882 Free PMC article.
-
Imaging Functional Recovery Following Ischemic Stroke: Clinical and Preclinical fMRI Studies.J Neuroimaging. 2020 Jan;30(1):5-14. doi: 10.1111/jon.12668. Epub 2019 Oct 13. J Neuroimaging. 2020. PMID: 31608550 Free PMC article. Review.
References
-
- Andrews RJ. Transhemispheric diaschisis. A review and comment. Stroke. 1991;22:943–949. - PubMed
-
- Auer DP. Spontaneous low-frequency blood oxygenation level-dependent fluctuations and functional connectivity analysis of the “resting” brain. Magn Reson Imaging. 2008;26:1055–1064. - PubMed
-
- Biswal B, Yetkin FZ, Haughton VM, Hyde JS. Functional connectivity in the motor cortex of resting human brain using echo-planar MRI. Magn Reson Med. 1995;34:537–541. - PubMed
-
- Biswal B, Hudetz AG, Yetkin FZ, Haughton VM, Hyde JS. Hypercapnia reversibly suppresses low-frequency fluctuations in the human motor cortex during rest using echo-planar MRI. J Cereb Blood Flow Metab. 1997;17:301–308. - PubMed
-
- Calautti C, Baron JC. Functional neuroimaging studies of motor recovery after stroke in adults: a review. Stroke. 2003;34:1553–1566. - PubMed
Publication types
MeSH terms
LinkOut - more resources
Full Text Sources
Medical