Comparative Study
. 2010 Mar 17;30(11):3995-4003.
doi: 10.1523/JNEUROSCI.4382-09.2010.

Removal of polysialic acid triggers dispersion of subventricularly derived neuroblasts into surrounding CNS tissues

Affiliations
Comparative Study

Removal of polysialic acid triggers dispersion of subventricularly derived neuroblasts into surrounding CNS tissues

Daniela Battista et al. J Neurosci. .

Abstract

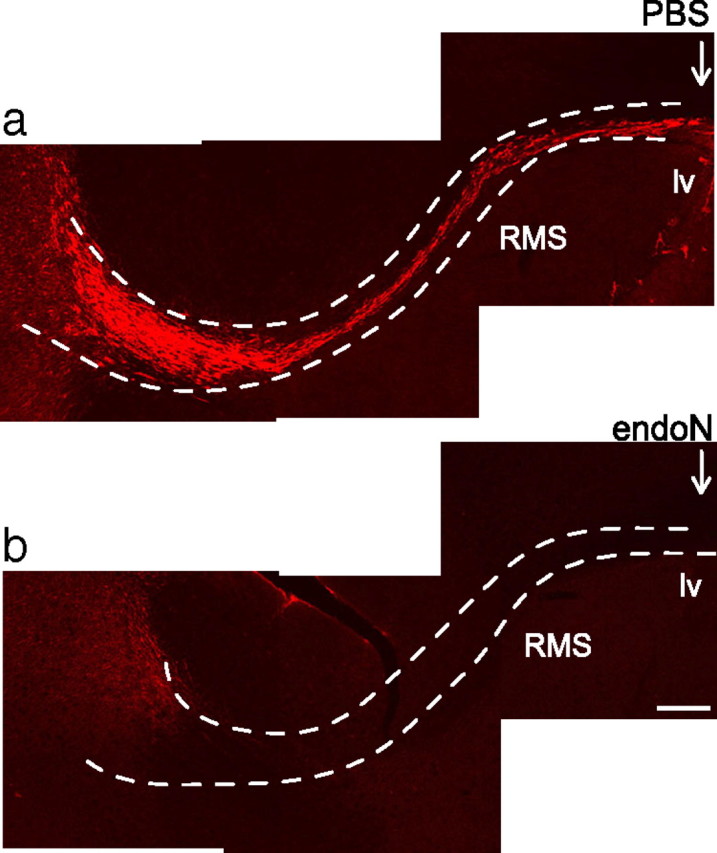
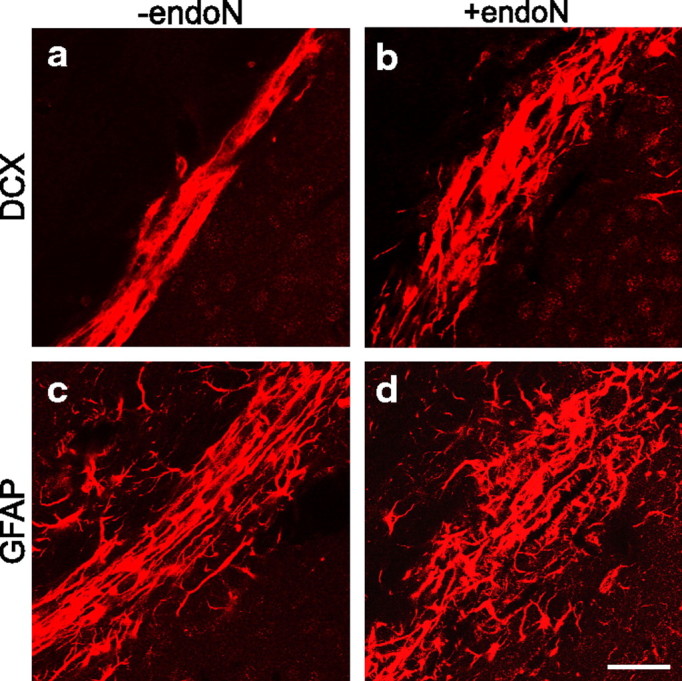
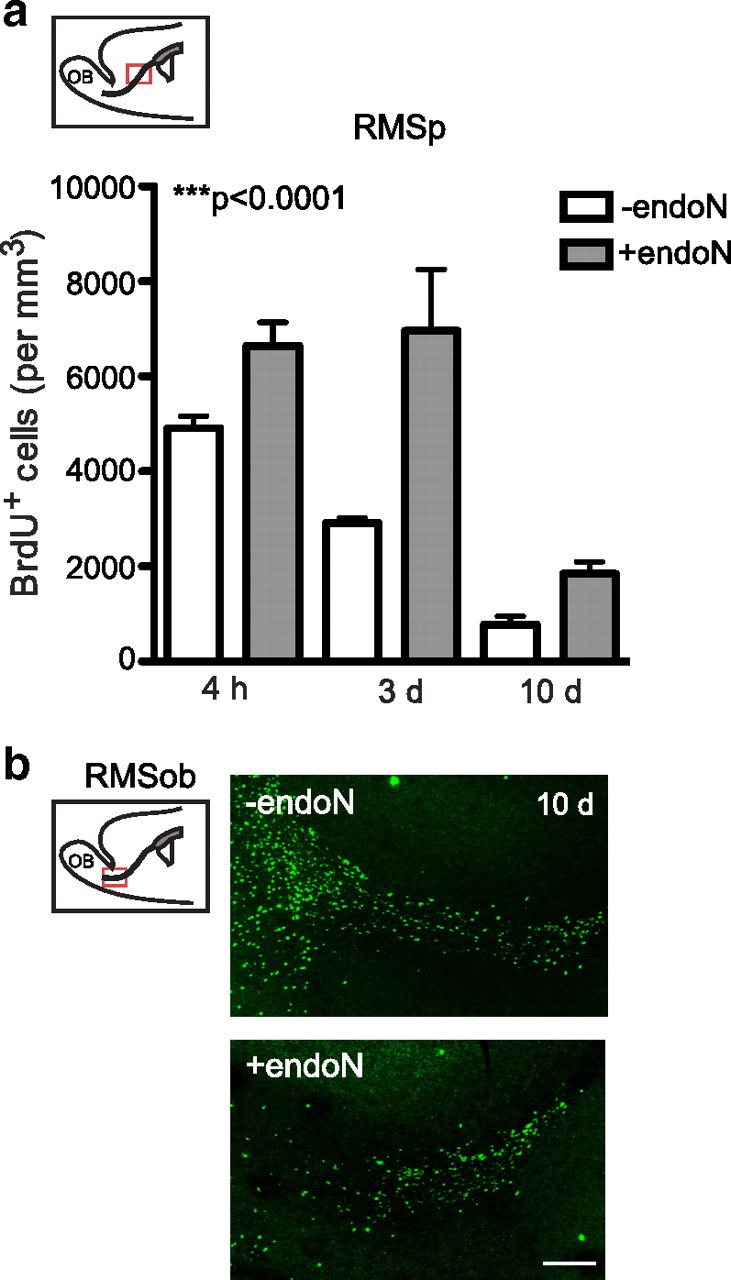
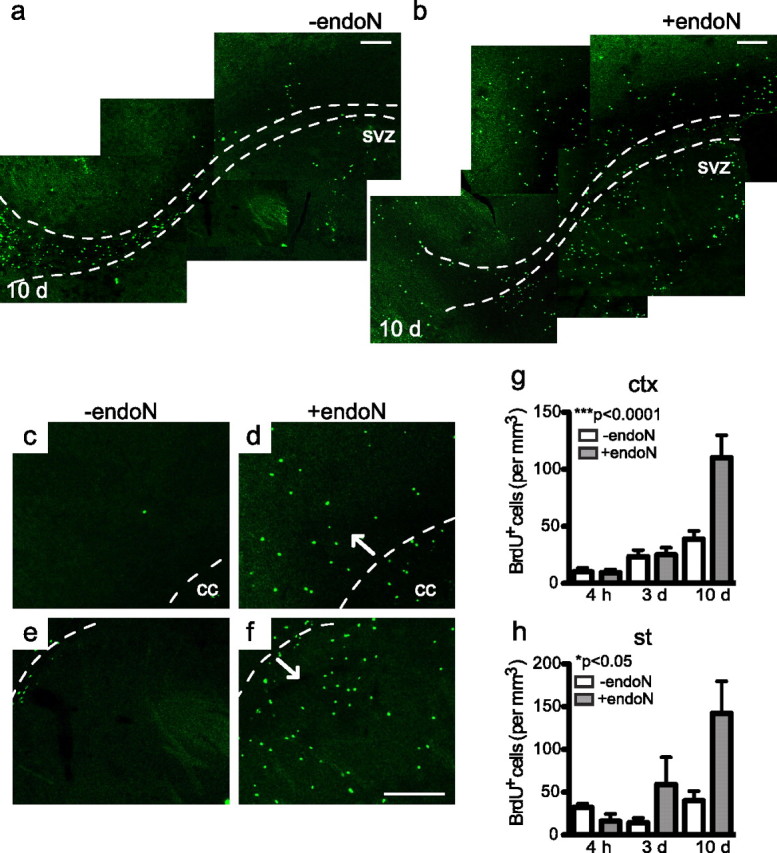
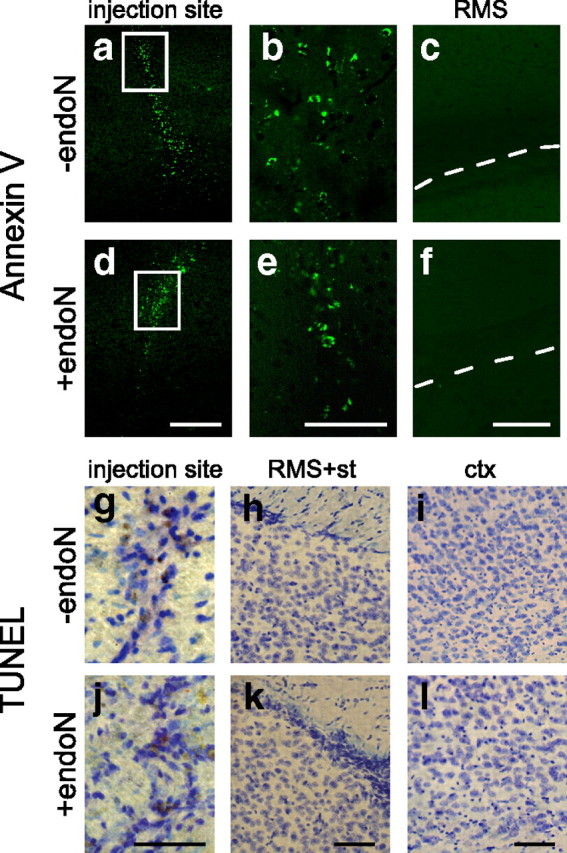
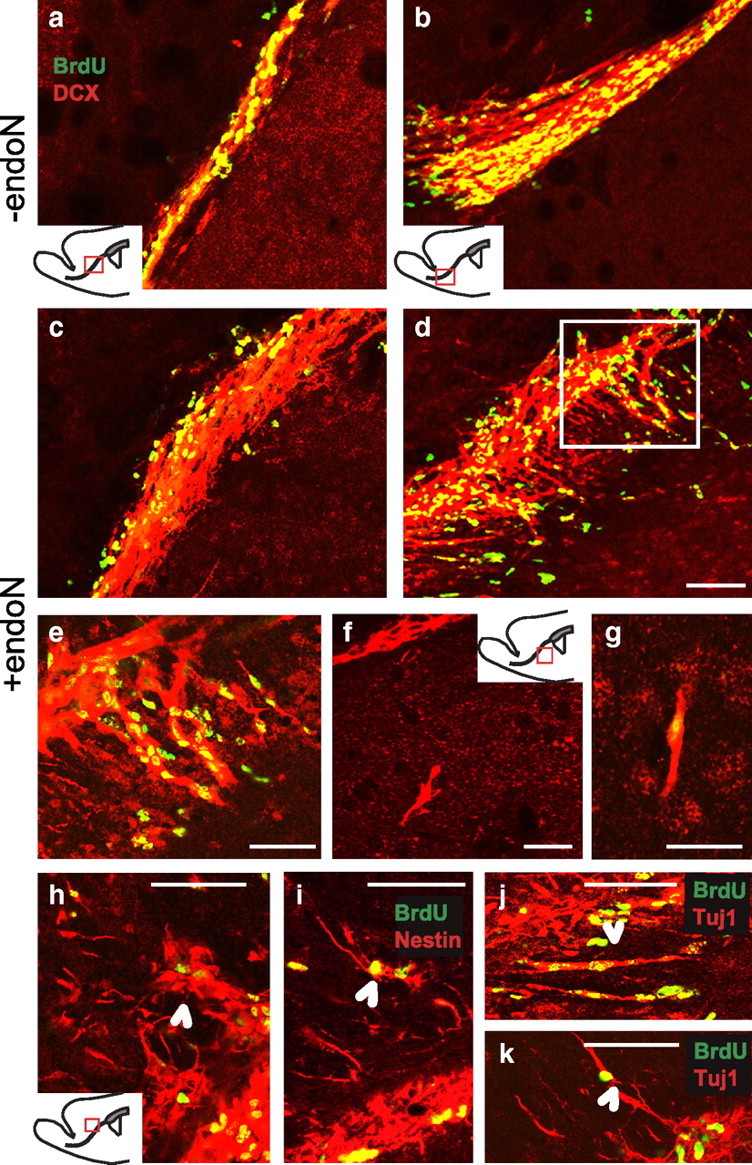
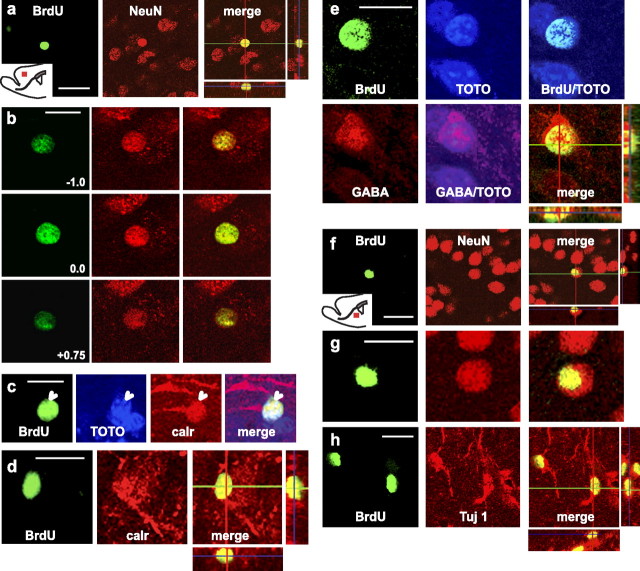
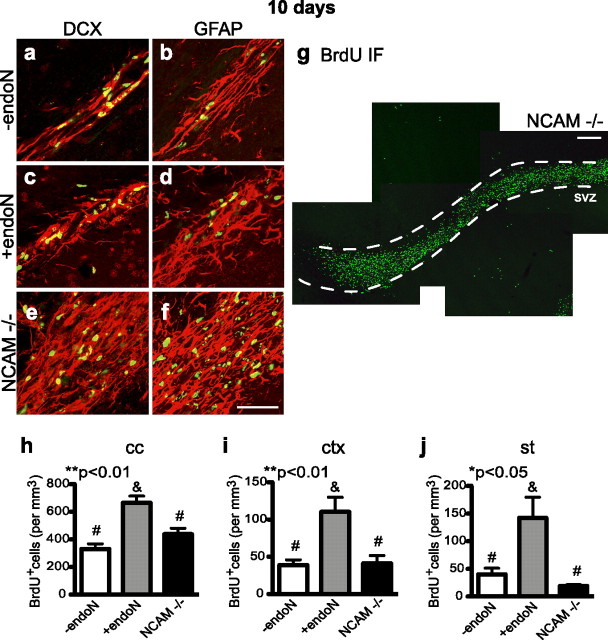
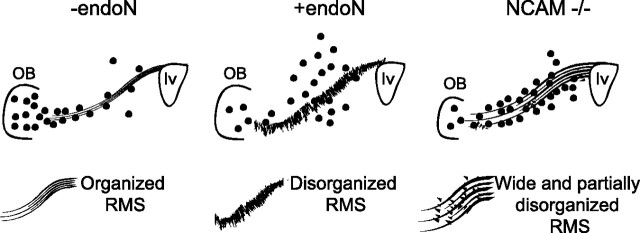
Cells generated in the subventricular zone give rise to neuroblasts that migrate to the olfactory bulb (OB) along the rostral migratory stream (RMS). The polysialylated form of neural cell adhesion molecule (PSA-NCAM) is expressed by these cells, and has been shown to both promote their migration and suppress differentiation induced by NCAM. In the present study, enzymatic removal of PSA from these neuroblasts using PSA-specific endoneuraminidase has been found not only to disrupt the tangential migration and cellular organization of the RMS, but also to cause a massive dispersion of BrdU (5-bromo-2'-deoxyuridine)-labeled neuroblasts into surrounding brain regions, including cortex and striatum. These dispersed cells are capable of differentiation, some into mature neurons, and could potentially be of value in the repair of CNS injury. Although the removal of PSA by genetic deletion of NCAM also results in a smaller OB and a swollen RMS, the cells do not escape the RMS in large numbers. These findings suggest that the presence of NCAM without PSA plays a role in the dispersion process, possibly by inducing a new pattern of migration associated with NCAM-dependent differentiation.


Figures

Figure 1.
Figure 1.
Removal of PSA from the RMS by endoN. a, b, PSA-NCAM immunofluorescence of sagittal sections of the RMS (dotted line). Either PBS (a) or endoN (b) was injected into the ventricle of 8-week-old BALB/c mice, and the tissue was examined after 10 d. Arrows indicate the injection site. lv, Lateral ventricle; RMS, rostral migratory stream. Scale bar, 200 μm.
Figure 2.
Figure 2.
Altered organization of the RMS in endoN-treated mice. a–d, Immunofluorescence for DCX (a, b) and GFAP (c, d) of sagittal sections of the RMS. The removal of PSA caused the disorganization of the RMS and neuroblast alignment with a loosening of the normally compact, tube-like astrocytic architecture. Glial processes were more scattered and not arranged tangential to the direction of neuroblast migration. A disruption of the tube-like structure can be seen. Note that the RMS has a wider diameter in endoN-treated brains. Scale bar, 20 μm.
Figure 3.
Figure 3.
Quantification of BrdU+ cells along the RMS at different time points. a, Number of BrdU+ cells along the RMS of PBS-injected (−endoN) or endoN-injected (+endoN) mice. Animals received a single BrdU injection 10 d after the intracranial injections and were killed at different time points (4 h, 3 d, and 10 d after the BrdU injection). Cells were quantified in the RMSp (inset). b, Representative photomicrographs of BrdU immunofluorescence in the RMSob. Note that the increase in the number of BrdU+ cells in the RMSp after PSA was removed was accompanied by a decrease in the number of cells that reached the OB, suggesting that cells are failing to migrate tangentially toward the olfactory bulb. It cannot be determined whether the increase in the number of cells in endoN-treated mice at 4 h compared with controls is due to cell retention or increased cell proliferation, and may in fact reflect a mixture of both phenomena. Values are the mean ± SEM; ***p < 0.0001, ANOVA (4 h: −endoN, n = 3 mice; +endoN, n = 3 mice; 3 and 10 d: −endoN, n = 5; +endoN, n = 6 mice). Scale bar, 200 μm.
Figure 4.
Figure 4.
Analysis of the BrdU+ cell population outside the RMS. a, b, BrdU immunofluorescence of control (a) and endoN-treated (b) mice 10 d after the BrdU injection. Representative photomicrographs of sagittal sections are shown. The dotted line outlines the RMS. Note the reduced number of cells in more anterior portions of the RMS (b) (Fig. 3b) and the increased number of cells outside the RMS. c–f, High-magnification image of BrdU staining in the cortex and striatum. Many positive cells can be seen in both areas after PSA has been removed (b, d, f). The dotted line outlines the corpus callosum in c and d, and the RMS in e and f. g, h, Quantification of BrdU+ cells in the cortex (g) and the striatum (h) at different time points. An increase in the density of BrdU+ cells was seen over time when PSA was removed. Values are the mean ± SEM; *p < 0.05, ***p < 0.0001, ANOVA (4 h: −endoN, n = 3 mice; +endoN, n = 3 mice; 3 and 10 d: −endoN, n = 5 mice; +endoN, n = 5 mice). cc, Corpus callosum; ctx, cortex; st, striatum. Scale bar, 100 μm.
Figure 5.
Figure 5.
Analysis of apoptosis. a–f, Representative photomicrographs showing annexin V staining of sagittal sections of control (a–c) and endoN-treated (d–f) brains 10 d after PBS or endoN injection. Positive cells can be seen around the injection site for both treatments (a, b, d, e). Very few positive cells were seen in the RMS and surrounding tissue, and no differences were seen between treatments. g–l, Representative micrographs showing TUNEL staining (DAB) of sagittal sections of control (g–i) and endoN-treated (j–l) brains 10 d after PBS or endoN injection. Some positive cells can be seen around the injection site (g, j) for both treatments, but very few positive cells could be seen in the RMS (h, k) or the cortex (i, l). No differences in the number of apoptotic cells were seen between treatments. Sections were counterstained with Nissl stain. ctx, Cortex; st, striatum. Scale bars: a, c, 200 μm; b, 100 μm; g–l, 50 μm.
Figure 6.
Figure 6.
Neuroblast organization 3 d after PSA removal. a–h, Double immunofluorescence labeling of BrdU (green) and DCX (red) of sagittal sections showing the RMS (a–e), the striatum (f, g), and the corpus callosum (h). e, Higher magnification of the panel outlined in d. i–k, Double immunofluorescence labeling of BrdU (green) and Nestin (i, red) or TuJ-1 (j, k, red) of sagittal sections of the RMS and the corpus callosum. An alteration in the orientation of neuroblast chains was observed after PSA was removed (e). Many neuroblasts seemed to be aligned orthogonally to the normal direction of migration and extended into the surrounding tissue either into the striatal matrix (f, g) or the corpus callosum (h–k, arrowheads). cc, Corpus callosum; ctx, cortex; st, striatum. Scale bars: a-d, f-k, 50 μm; e, 20 μm.
Figure 7.
Figure 7.
Differentiation of BrdU+ cells present in the cortex and striatum at 21 d. a–h, Confocal z-scanning images of BrdU-double labeled cells with different cell markers. EndoN-injected animals received six consecutive injections of BrdU (twice daily over 3 d) and were killed 21 d after the end of treatment. a, b, Confocal micrograph of a BrdU/NeuN+ cell in the cortex. a, An individual z-plane is shown with the orthogonal projection (right). b, z-axis projections of the same cell shown in a. c–e, Confocal micrograph of BrdU+ cells labeled with calretinin (c, d) and GABA (e) in the cortex. Cell nuclei were visualized with TOTO-3 iodide to discriminate positive cells (c, e). d, e, Orthogonal projections of the BrdU-double labeled cells. f, Confocal micrograph of a BrdU/NeuN+ cell in the striatum. g, Higher magnification of the double-labeled cells in f. h, Confocal micrograph of a BrdU/Tuj+ cell in the striatum. Some BrdU+ cells showed labeling with mature neuronal markers such as NeuN. In the cortex, some cells differentiated into specific GABAergic neurons positive for calretinin or GABA, whereas in the striatum a high percentage of cells expressed immature neuronal markers (Table 1). calr, Calretinin. Scale bars: a, f, 10 μm; b-e, g, h, 20 μm.
Figure 8.
Figure 8.
Organization of the RMS and BrdU+ cells in NCAM-deficient mutant mice. a–f, Immunofluorescence for BrdU (green) and DCX (a, c, e, red) or GFAP (b, d, f, red) of sagittal sections of the RMS of control (a, b), endoN-treated (c, d), and NCAM-deficient (e, f) mice at 10 d. g, BrdU staining of sagittal sections of the RMS (dotted line) of NCAM-deficient mice. h–j, Comparison of the number of BrdU+ cells in the corpus callosum (h), cortex (i), and striatum (j) among control, endoN-injected, and NCAM-deficient mice 10 d after the BrdU injection. NCAM-deficient mice had a wide and disorganized RMS with many BrdU+ nuclei; however, the number of positive cells outside the RMS was similar to that for control mice. Values are the mean ± SEM; *p < 0.05, **p < 0.01, ANOVA, with Bonferroni post-test (−endoN, n = 5; +endoN n = 5; NCAM−/−, n = 4). cc, Corpus callosum; ctx, cortex; st, striatum. Scale bars: a–f, 50 μm; g, 100 μm.
Figure 9.
Figure 9.
Comparison of RMS structure and BrdU staining in endoN-treated and NCAM-deficient mice. Schematic diagram showing the structure of the RMS and the appearance of BrdU+ cells (dots) at 10 d among control (−endoN), PSA-depleted (+endoN), and NCAM-deficient (NCAM−/−) mice. In the absence of PSA-NCAM, cells failed to migrate to the OB and accumulated along the RMS, whereas when PSA was removed cells dispersed from the RMS into the surrounding tissue, where they maintained their ability to differentiate into neurons. The large difference in BrdU+ cell distribution is accompanied by more subtle differences in the organization of the RMS. NCAM-deficient mice show a partially disorganized astrocytic tube-like organization, maintaining part of the structure seen in control RMS, where neuroblasts are arranged in chains aligned parallel to the direction of migration. When PSA is depleted the overall organization of the RMS is disrupted. lv, Lateral ventricle.

Similar articles

Cited by

References

    1. Alonso G, Prieto M, Chauvet N. Tangential migration of young neurons arising from the subventricular zone of adult rats is impaired by surgical lesions passing through their natural migratory pathway. J Comp Neurol. 1999;405:508–528. - PubMed
    1. Altman J. Autoradiographic and histological studies of postnatal neurogenesis. IV. Cell proliferation and migration in the anterior forebrain, with special reference to persisting neurogenesis in the olfactory bulb. J Comp Neurol. 1969;137:433–457. - PubMed
    1. Amoureux MC, Cunningham BA, Edelman GM, Crossin KL. N-CAM binding inhibits the proliferation of hippocampal progenitor cells and promotes their differentiation to a neuronal phenotype. J Neurosci. 2000;20:3631–3640. - PMC - PubMed
    1. Angata K, Huckaby V, Ranscht B, Terskikh A, Marth JD, Fukuda M. Polysialic acid-directed migration and differentiation of neural precursors are essential for mouse brain development. Mol Cell Biol. 2007;27:6659–6668. - PMC - PubMed
    1. Arvidsson A, Collin T, Kirik D, Kokaia Z, Lindvall O. Neuronal replacement from endogenous precursors in the adult brain after stroke. Nat Med. 2002;8:963–970. - PubMed

Publication types

MeSH terms