

Searching for autocoherence in the cortical network with a time-frequency analysis of the local field potential
- PMID: 20237274
- PMCID: PMC2897248
- DOI: 10.1523/JNEUROSCI.5319-09.2010
Searching for autocoherence in the cortical network with a time-frequency analysis of the local field potential
Abstract
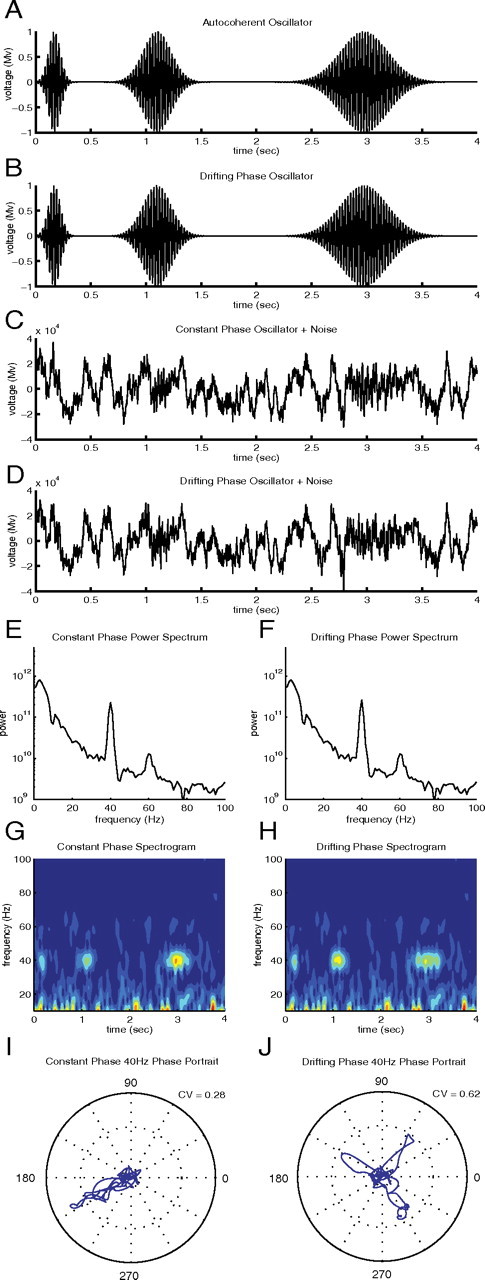
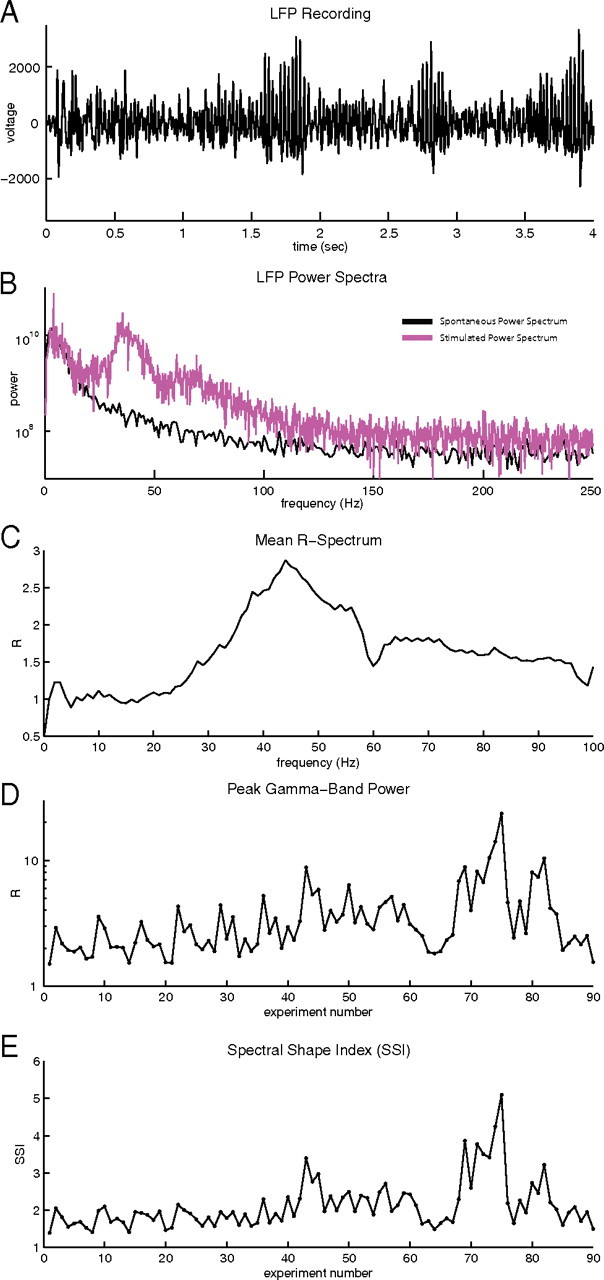
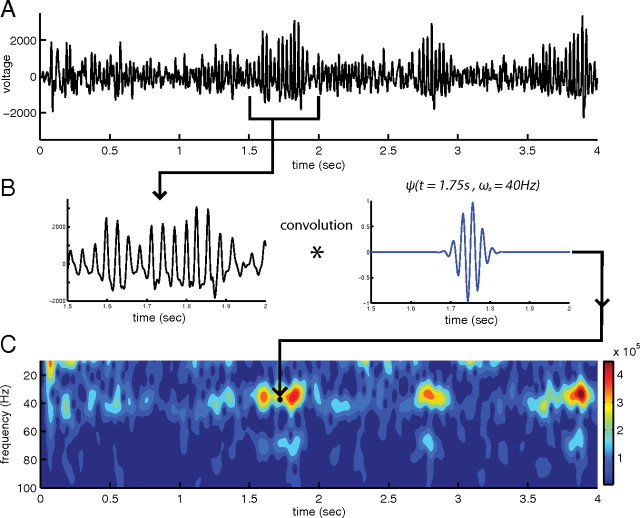
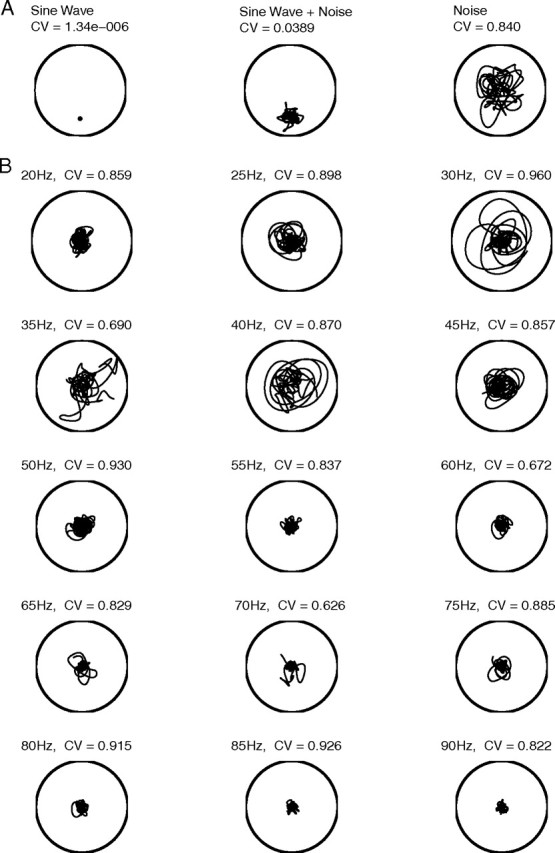
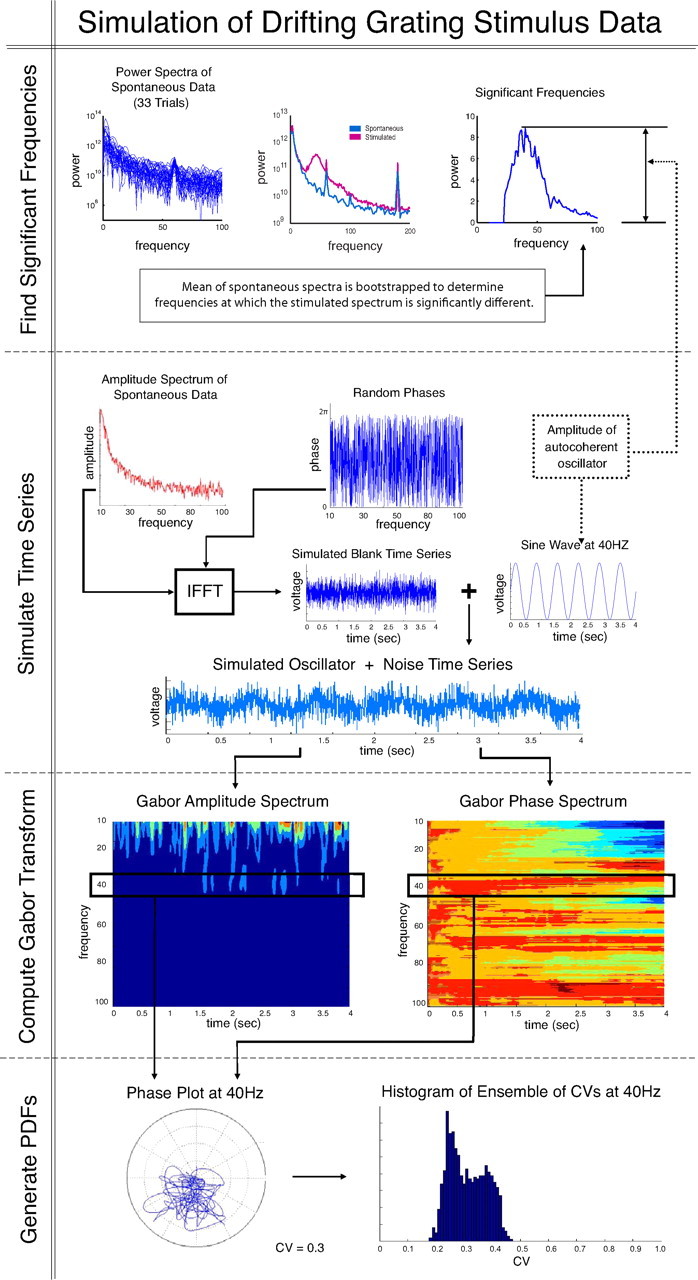
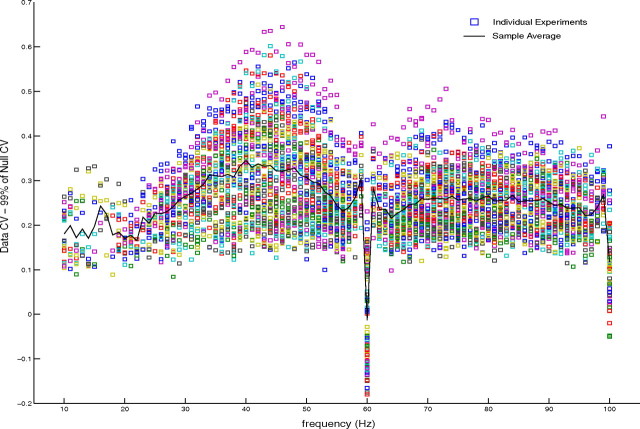
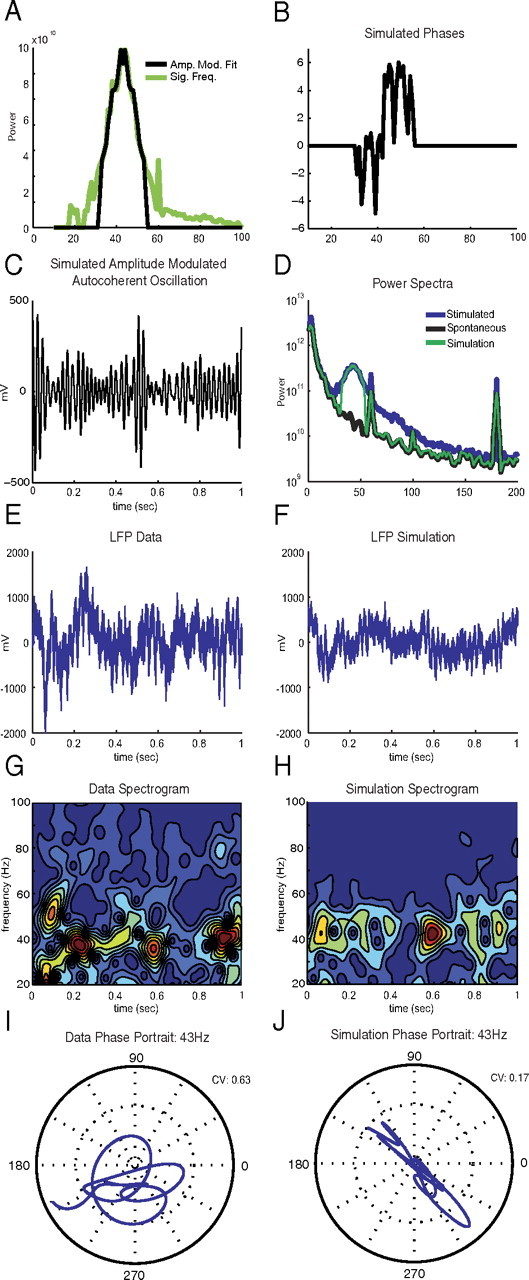
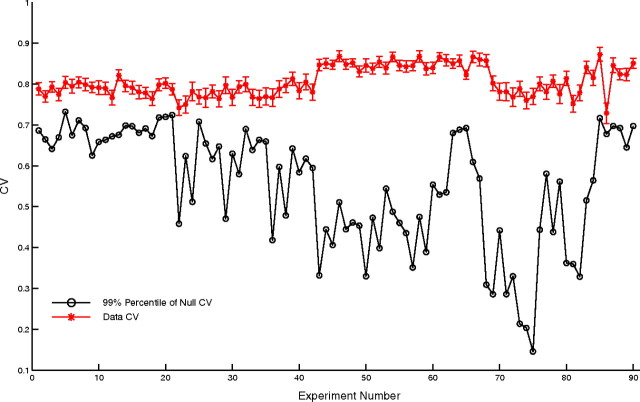
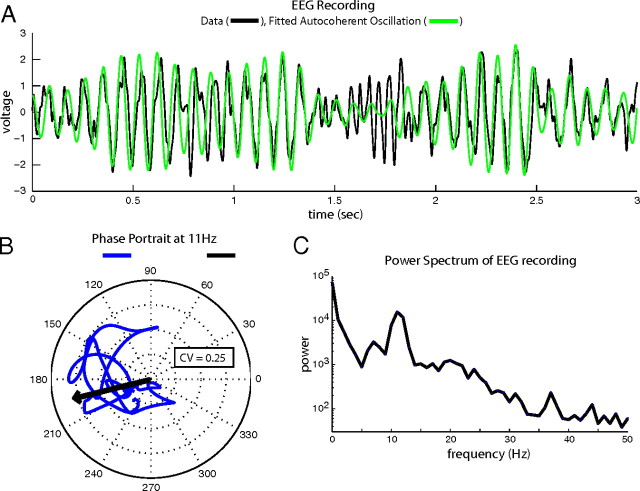
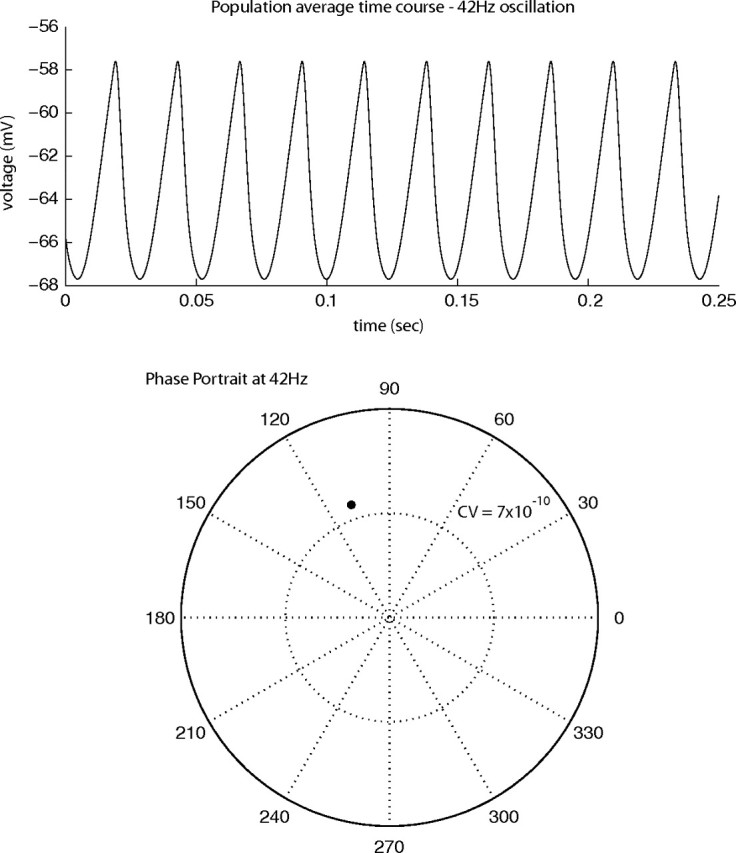
Gamma-band peaks in the power spectrum of local field potentials (LFP) are found in multiple brain regions. It has been theorized that gamma oscillations may serve as a 'clock' signal for the purposes of precise temporal encoding of information and 'binding' of stimulus features across regions of the brain. Neurons in model networks may exhibit periodic spike firing or synchronized membrane potentials that give rise to a gamma-band oscillation that could operate as a 'clock'. The phase of the oscillation in such models is conserved over the length of the stimulus. We define these types of oscillations to be 'autocoherent'. We investigated the hypothesis that autocoherent oscillations are the basis of the experimentally observed gamma-band peaks: the autocoherent oscillator (ACO) hypothesis. To test the ACO hypothesis, we developed a new technique to analyze the autocoherence of a time-varying signal. This analysis used the continuous Gabor transform to examine the time evolution of the phase of each frequency component in the power spectrum. Using this analysis method, we formulated a statistical test to compare the ACO hypothesis with measurements of the LFP in macaque primary visual cortex, V1. The experimental data were not consistent with the ACO hypothesis. Gamma-band activity recorded in V1 did not have the properties of a 'clock' signal during visual stimulation. We propose instead that the source of the gamma-band spectral peak is the resonant V1 network driven by random inputs.
Figures
Similar articles
-
Is gamma-band activity in the local field potential of V1 cortex a "clock" or filtered noise?J Neurosci. 2011 Jun 29;31(26):9658-64. doi: 10.1523/JNEUROSCI.0660-11.2011. J Neurosci. 2011. PMID: 21715631 Free PMC article.
-
LFP spectral peaks in V1 cortex: network resonance and cortico-cortical feedback.J Comput Neurosci. 2010 Dec;29(3):495-507. doi: 10.1007/s10827-009-0190-2. Epub 2009 Oct 28. J Comput Neurosci. 2010. PMID: 19862612 Free PMC article.
-
Stochastic generation of gamma-band activity in primary visual cortex of awake and anesthetized monkeys.J Neurosci. 2012 Oct 3;32(40):13873-80a. doi: 10.1523/JNEUROSCI.5644-11.2012. J Neurosci. 2012. PMID: 23035096 Free PMC article.
-
Phase correlation among rhythms present at different frequencies: spectral methods, application to microelectrode recordings from visual cortex and functional implications.Int J Psychophysiol. 1997 Jun;26(1-3):171-89. doi: 10.1016/s0167-8760(97)00763-0. Int J Psychophysiol. 1997. PMID: 9203002 Review.
-
Pattern separation and synchronization in spiking associative memories and visual areas.Neural Netw. 2001 Jul-Sep;14(6-7):763-80. doi: 10.1016/s0893-6080(01)00084-3. Neural Netw. 2001. PMID: 11665769 Review.
Cited by
-
Gamma rhythms in the brain.PLoS Biol. 2011 Apr;9(4):e1001045. doi: 10.1371/journal.pbio.1001045. Epub 2011 Apr 12. PLoS Biol. 2011. PMID: 21556334 Free PMC article. No abstract available.
-
A state space modeling approach to real-time phase estimation.Elife. 2021 Sep 27;10:e68803. doi: 10.7554/eLife.68803. Elife. 2021. PMID: 34569936 Free PMC article.
-
Induced cortical oscillations in turtle cortex are coherent at the mesoscale of population activity, but not at the microscale of the membrane potential of neurons.J Neurophysiol. 2017 Nov 1;118(5):2579-2591. doi: 10.1152/jn.00375.2017. Epub 2017 Aug 9. J Neurophysiol. 2017. PMID: 28794194 Free PMC article.
-
Stimulus selectivity and spatial coherence of gamma components of the local field potential.J Neurosci. 2011 Jun 22;31(25):9390-403. doi: 10.1523/JNEUROSCI.0645-11.2011. J Neurosci. 2011. PMID: 21697389 Free PMC article.
-
A method for closed-loop presentation of sensory stimuli conditional on the internal brain-state of awake animals.J Neurosci Methods. 2013 Apr 30;215(1):139-55. doi: 10.1016/j.jneumeth.2013.02.020. Epub 2013 Mar 6. J Neurosci Methods. 2013. PMID: 23473800 Free PMC article.
References
-
- Abbott LF, van Vreeswijk C. Asynchronous states in a network of pulse-coupled oscillators. Phys Rev E. 1993;48:1483–1490. - PubMed
-
- Bartos M, Vida I, Jonas P. Synaptic mechanisms of synchronized gamma oscillations in inhibitory interneuron networks. Nature Rev Neurocsci. 2007;8:45–56. - PubMed
-
- Battaglia D, Brunel N, Hansel D. Temporal decorrelation of collective oscillations in neural networks with local inhibition and long-range excitation. Phys Rev Let. 2007;99:238106. - PubMed
-
- Bauer R, Brosch M, Eckhorn R. Different rules of spatial summation from beyond the receptive field for spike rates and oscillation amplitudes in cat visual cortex. Brain Res. 1995;669:291–297. - PubMed
Publication types
MeSH terms
Grants and funding
LinkOut - more resources
Full Text Sources