Comparative Study
. 2010 Mar 17;30(11):4120-31.
doi: 10.1523/JNEUROSCI.5185-09.2010.

Pals1 is a major regulator of the epithelial-like polarization and the extension of the myelin sheath in peripheral nerves

Affiliations
Comparative Study

Pals1 is a major regulator of the epithelial-like polarization and the extension of the myelin sheath in peripheral nerves

Murat Ozçelik et al. J Neurosci. .

Abstract

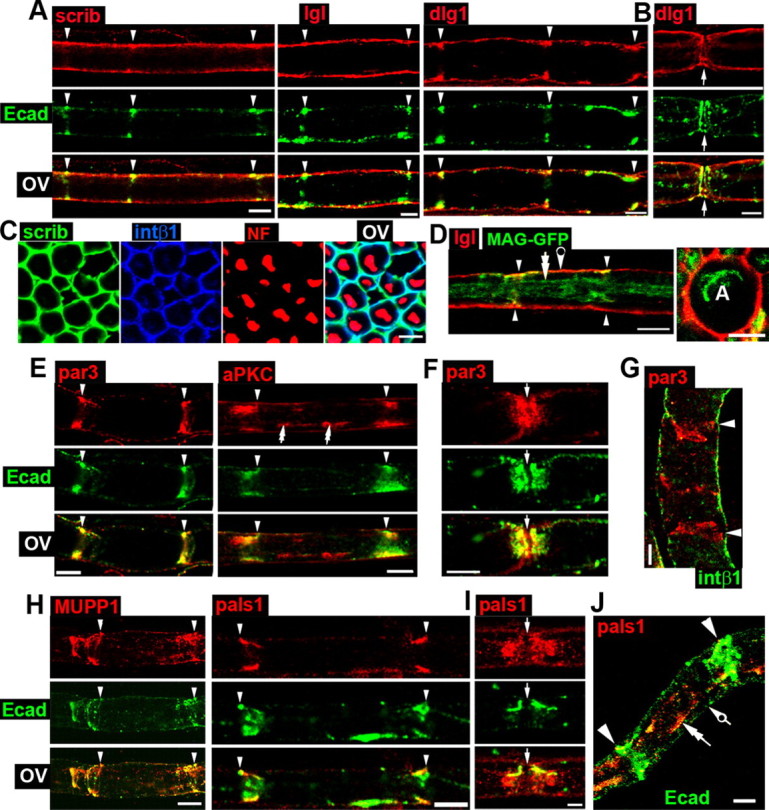
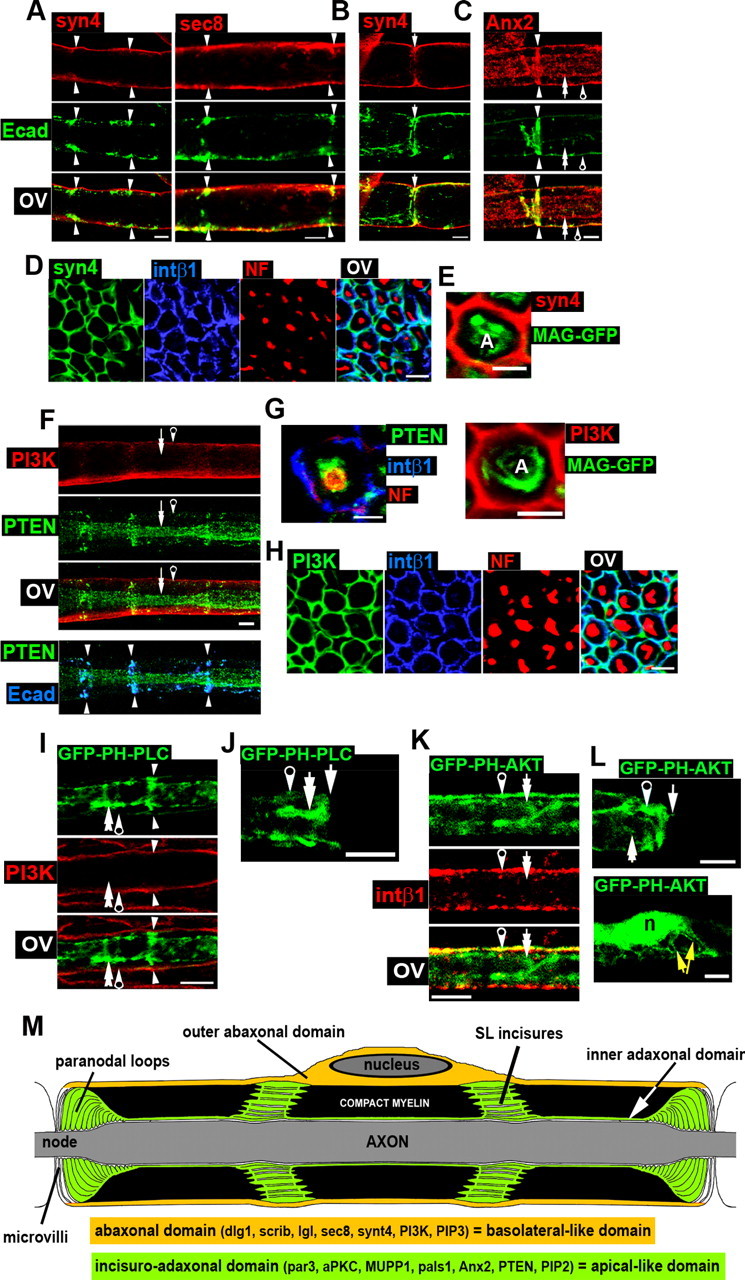
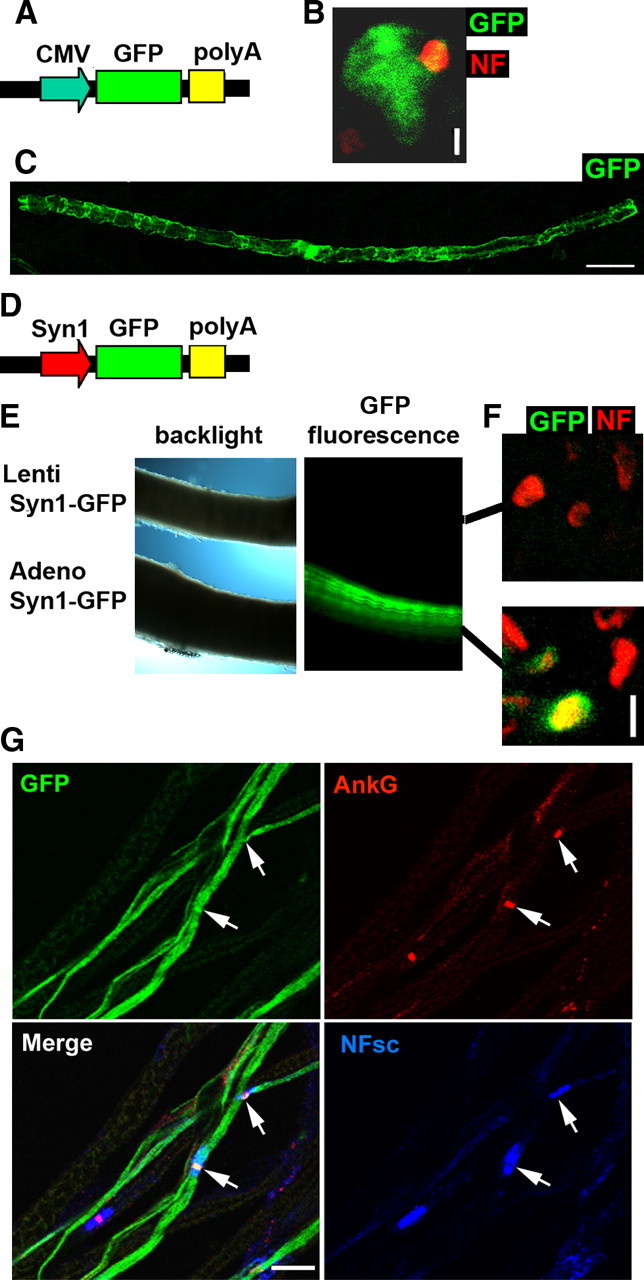
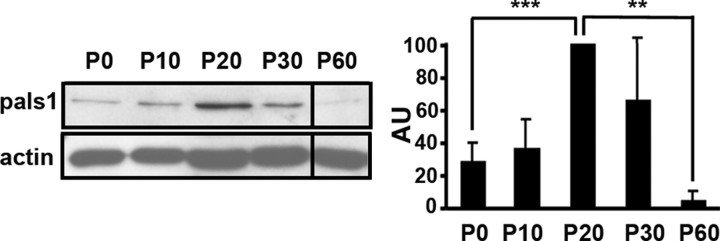
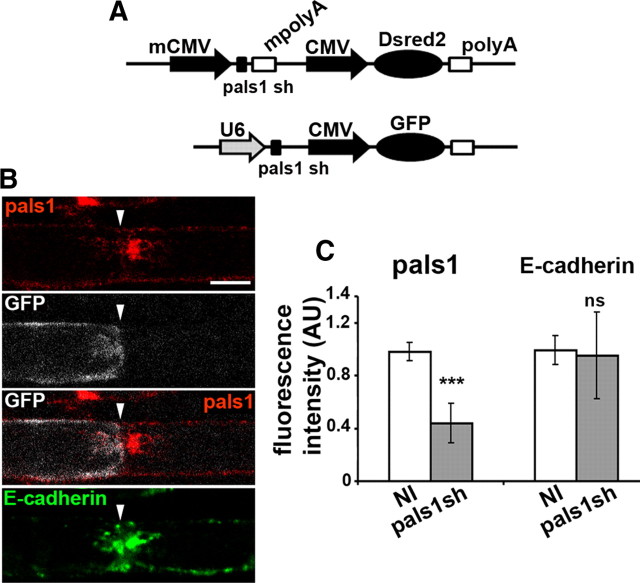
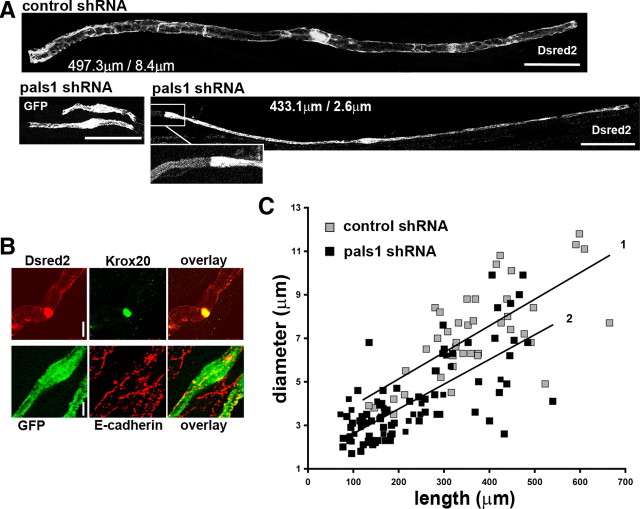
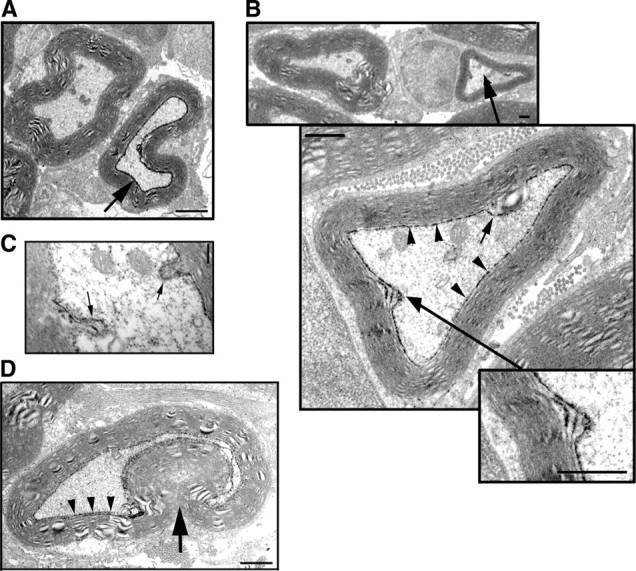
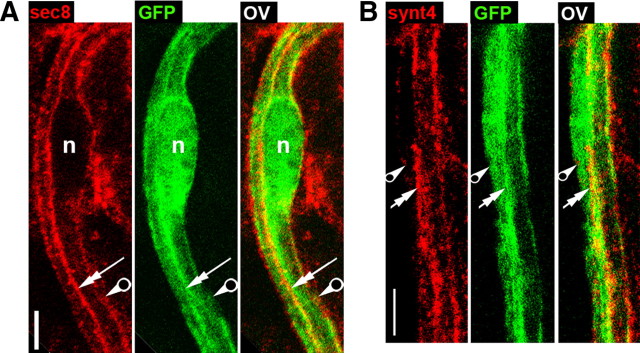
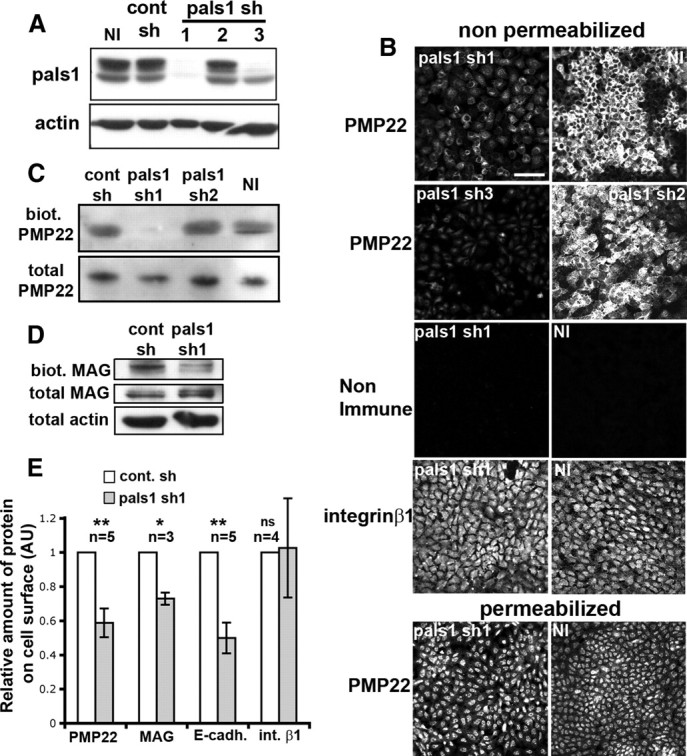
Diameter, organization, and length of the myelin sheath are important determinants of the nerve conduction velocity, but the basic molecular mechanisms that control these parameters are only partially understood. Cell polarization is an essential feature of differentiated cells, and relies on a set of evolutionarily conserved cell polarity proteins. We investigated the molecular nature of myelin sheath polarization in connection with the functional role of the cell polarity protein pals1 (Protein Associated with Lin Seven 1) during peripheral nerve myelin sheath extension. We found that, in regard to epithelial polarity, the Schwann cell outer abaxonal domain represents a basolateral-like domain, while the inner adaxonal domain and Schmidt-Lanterman incisures form an apical-like domain. Silencing of pals1 in myelinating Schwann cells in vivo resulted in a severe reduction of myelin sheath thickness and length. Except for some infoldings, the structure of compact myelin was not fundamentally affected, but cells produced less myelin turns. In addition, pals1 is required for the normal polarized localization of the vesicular markers sec8 and syntaxin4, and for the distribution of E-cadherin and myelin proteins PMP22 and MAG at the plasma membrane. Our data show that the polarity protein pals1 plays an essential role in the radial and longitudinal extension of the myelin sheath, likely involving a functional role in membrane protein trafficking. We conclude that regulation of epithelial-like polarization is a critical determinant of myelin sheath structure and function.


Figures

Figure 1.
Figure 1.
Distribution of cell polarity proteins in myelinating Schwann cells. Arrowheads indicate SL incisures, white arrows the node of Ranvier, double arrows the adaxonal domain, and pierced arrows the abaxonal domain. A, Immunostaining of scrib, lgl, and dlg1 (red) and E-cadherin (green) in myelinating Schwann cells shows their distributions in the abaxonal domain. B, Immunostaining of dlg1 (red) and E-cadherin (green) at the node of Ranvier (arrows) suggests dlg1 localization in the outer region of paranodal loops. Scale bar, 2.5 μm. C, Immunostaining of scrib (green), integrin β1 (blue), and neurofilaments (NF, red) in sciatic nerve cross sections shows scrib colocalizes with integrin β1 in the abaxonal domain. D, Left, Immunostaining of dlg1 (red) in Schwann cells expressing MAG-GFP (green) show dlg1 is not colocalized with MAG in the adaxonal domain. Right, Same immunostaining on sciatic nerve cross sections. A, Axon. E, Immunostaining of par3 and aPKC (red) and E-cadherin (green) in teased fibers shows their localization in SL incisures. F, par3 (red) and E-cadherin (green) immunostaining at a node of Ranvier (arrows) shows their partial colocalization in the middle part of paranodal loops. G, Par3 (red) and integrin β1 (green) do not colocalize (immunostaining in teased fibers). H, MUPP1 and pals1 (red) and E-cadherin (green) colocalize in SL incisures (immunostaining in teased fibers). I, Immunostainings of pals1 (red) and E-cadherin (green) at a node of Ranvier suggest pals1 localization in the inner region of paranodal loops. J, pals1 (red) is localized in the adaxonal domain of Schwann cells, while E-cadherin (green) is mostly expressed in SL incisures. Nerve tissue was from 2-month-old mice, except pals1 stainings, which were performed on tissue from 1-month-old mice. All scale bars are 5 μm otherwise indicated. OV, Overlay.
Figure 2.
Figure 2.
Distribution of polarized vesicular markers, phosphoinositides, PI3K, and PTEN in myelinating Schwann cells. Arrows and arrowheads are as in Figure 1. A, Immunostaining of syntaxin4 (syn4, red) and sec8 (red) reveals the localizations of these proteins in the abaxonal domain with partial colocalization with E-cadherin (green). B, Syntaxin4 (red) is present in the outer region of paranodal loops [E-cadherin (green)]. C, Immunostaining of annexin A2 (Anx2, red) shows its localization in the adaxonal domain and in SL incisures, where Anx2 colocalizes with E-cadherin (green). D, Immunostaining of syntaxin4 (syn4, green), integrin β1 (blue), and NF (red) in sciatic nerve cross sections. Syntaxin 4 colocalizes with integrin β1 in the abaxonal domain. E, No colocalization can be seen between syntaxin4 (red) and MAG-GFP (green) in Schwann cells in sciatic cross sections. A, Axon. F, Upper panel, PI3K (red) and PTEN (green) are localized in abaxonal and adaxonal domains (and SL incisures), respectively, in teased fibers. Lower panel, Overlay of PTEN (green) and E-cadherin (blue) shows their colocalization in SL incisures. G, Left, Immunostaining of PTEN (green), integrin β1 (blue), and NF (red) on nerve cross sections shows PTEN localization around the axon (stained for neurofilaments), confirming that PTEN is expressed in the adaxonal domain of SCs. Scale bar, 2.5 μm. Right, Immunostaining of PI3K (red) on Schwann cells expressing MAG-GFP (green) shows no colocalization in the adaxonal domain. A, Axon. H, PI3K (green) colocalizes with integrin β1 (blue) in the abaxonal domain. NF (red) staining shows axons in sciatic nerve cross sections. I, A myelinating Schwann cell expressing GFP-PH-PLCδ (green) shows the probe localization in SL incisures and in the adaxonal domain. No colocalization is observed with PI3K (red) in the abaxonal domain. J, GFP labeling at a node of Ranvier of a cell expressing GFP-PH-PLCδ is enriched in the inner part of paranodal loops. K, A myelinating Schwann cell expressing GFP-PH-AKT (green) show its localization in all compartments with enrichment in the abaxonal domain, where the probe colocalizes with integrin β1 (red). L, Upper panel, GFP-PH-AKT (green) is enriched in the outer region of paranodal loops at a node of Ranvier. Lower panel, The same probe is present in the perinuclear area and in Cajal bands (yellow arrows, abaxonal domain). n, Nucleus. M, This schematic drawing shows the structure of a myelinating Schwann cell, the characterized polarity domains, and a summary of the observed localizations of markers. Tissue was from 2-month-old mice, except for stainings of cells expressing GFP probes, for which mice were 10–20 d old. Unless otherwise indicated, all scale bars are 5 μm. OV, Overlay.
Figure 3.
Figure 3.
Lentiviral vectors infect myelinating Schwann cells in mouse sciatic nerve. A, CMV-GFP cassette in psicoR lentiviral vector. B, A myelinating Schwann cell infected with psicoR virus expresses GFP (green) and wraps an axon stained for NF (red). The analysis was performed 10 d after injection of lentivirus in nerves of 3- to 4-d-old mouse pups. Scale bar, 5 μm. C, A myelinating Schwann cell infected with psicoR virus expresses GFP (green) 30 d after infection. Scale bar, 50 μm D, Synapsin1 promoter cassette. E, Mouse sciatic nerves were injected with Syn1-GFP lentivirus (upper nerve) or adenovirus (lower nerve). Only the nerve injected with adenovirus syn1-GFP expresses GFP in neurons. Both syn1-GFP viruses expressed GFP in DRG neurons in culture, showing that they were infectious (data not shown). F, Cryosections were obtained from nerves injected with syn1-GFP lentivirus or adenovirus. Adenovirus syn1-GFP expressed GFP (green) in axons, where it colocalizes with NF (red). Scale bar, 2 μm. G, Teased fibers from a nerve injected with adenovirus syn1-GFP show GFP-labeled axons (green) overlapping with a nodal staining of ankyrin G (red) and neurofascins (blue, pan-neurofascin antibody). Arrows indicate nodes of Ranvier. Scale bar, 20 μm.
Figure 4.
Figure 4.
Expression of pals1 is regulated during sciatic nerve myelination. Left panel, Western blot analysis of pals1 expression during postnatal development of mouse sciatic nerve. Actin was used as loading control. Right panel, Densitometric quantification of the Western blot analysis. Pals1 values are normalized to the respective actin values (±SD; n = 3). p values = 0.0005 (P0–P20), 0.002 (P20–P60). AU, Arbitrary unit.
Figure 5.
Figure 5.
Lentivirus expressing pals1 shRNA silences pals1 expression efficiently in mSCs in vivo. A, Schematic structure of the two expression cassettes used to express pals1 shRNA with a pSICOR lentiviral vector backbone. mCMV, Minimal CMV promoter; mpolyA, minimum polyA; U6, U6 promoter. B, At a node of Ranvier (arrowhead), a cell infected with pals1 shRNA virus expresses GFP (white) and shows a strongly reduced expression of pals1 (red) in the inner part of paranodal loops (see also Fig. 1I for control). E-cadherin expression is not changed (green). Scale bar, 10 μm. C, Fluorescence intensity for pals1 is reduced in cells infected with pals1 shRNA virus (pals1 sh) versus surrounding noninfected cells (NI) (±SEM). E-cadherin fluorescence intensity is not significantly changed (ns). Number of cells counted: Pals1, 15; E-cadherin, 16. p values = 1.3 × 10⁻¹⁰ (pals1), 0.6 (E-cadherin). AU, Arbitrary unit.
Figure 6.
Figure 6.
Pals1 is required for radial and longitudinal extension of the myelin sheath. A, Cells infected with pals1 shRNA virus express Dsred2 or GFP (white) and show an abnormally thin diameter (right lower panel, 2.6 μm diameter for 433.1 μm length) and a reduced length (left lower panel) in comparison to a cell infected with control shRNA vector (upper panel, 8.4 μm diameter for 497.3 μm). The inset shows the detail of the left node of Ranvier of the pals1-silenced cell. Scale bars, 50 μm. B, Short cells infected with pals1 shRNA virus express Dsred2 (red) and Krox20 (green) (upper panels), GFP (green), and E-cadherin (red) (lower panels). Scale bars, 5 μm. C, Graph displaying cell diameter versus length of mSCs infected with viruses expressing control shRNA (gray squares) and pals1 shRNA (black squares). Lines show linear regressions lines for control shRNA (1) and pals1 shRNA (2). Tissue was from mice injected 3–4 d after birth and analyzed 2 months later.
Figure 7.
Figure 7.
Pals1 silencing reduces compact myelin sheath thickness and induces myelin infoldings. A, Thin-section electron micrograph of sciatic nerve from a 2-month-old mouse sciatic nerve injected at postnatal day 3–4 with a lentivirus expressing PLAP. A myelinating Schwann cell expressing PLAP displays black precipitates in its adaxonal domain (arrow), while a noninfected cell (left cell) shows no PLAP staining. Scale bar, 1.2 μm. B, Thin-section electron micrographs showing three successive magnifications of the same cell in a mouse nerve injected with a lentivirus expressing pals1 shRNA and PLAP. A Schwann cell expressing pals1 shRNA and PLAP (black precipitates, arrowheads) shows an abnormally thin myelin sheath (g ratio = 0.78) and two protrusions of the adaxonal domain into the axon (arrows). The small inset shows a detail in which PLAP staining is observed on three successive noncompacted membranes, which is characteristic of incisural membranes. Scale bars, 500 nm. C, Detail of an axon showing two Schwann cell protrusions (arrows) into the axonal compartment. Note that adaxonal membranes of the protrusions are labeled by PLAP staining, indicating that the Schwann cell expresses pals1 shRNA. Scale bar, 200 nm. D, A myelinated Schwann cell infected with pals1 shRNA virus displays a PLAP staining at the interface with the axon (arrowheads) and a prominent infolding of the myelin into the axon (arrow). Scale bar, 800 nm.
Figure 8.
Figure 8.
Pals1 is required for the polarized distribution of sec8 and syntaxin4 in myelinating Schwann cell in vivo. A, B, Immunostaining of sec8 (A) and syntaxin4 (B) (red) in a myelinating Schwann cell expressing pals1 shRNA and GFP (green). Sec8 and syntaxin4 distribute to the inner adaxonal domain (double arrows) in addition to the outer abaxonal domain (pierced arrow) as observed in control cells. Control cell stainings are illustrated in Figure 2A. Scale bars, 5 μm. Sciatic nerves from mice injected with pals1 shRNA virus at postnatal day 3–4 and analyzed 2 months later.
Figure 9.
Figure 9.
Pals1 silencing reduces the amount of PMP22, MAG, and E-cadherin but not integrin β1 at the plasma membrane. A, The efficiency of three pals1 shRNAs (pals1 sh) in silencing pals1 in rat epithelial cells WB-F344 was analyzed by Western blotting. Pals1 shRNA 1 and 3 are the most efficient, while 2 is not active. Cont sh, Control sh. B, Immunostaining of PMP22 and integrin β1 on WB-F344 cells under permeabilized or nonpermeabilized conditions. Cells were not infected (NI) or infected with lentivirus expressing pals1 shRNA 1, 2, or 3 (pals1 sh), and selected with puromycin before immunostaining. Cells expressing the effective pals1 sh1 or 3 show reduced PMP22 but not reduced integrin β1 staining at their membranes. Note that cells silenced for pals1 are larger and less numerous at confluency; thus, the overall integrin β1 staining appears stronger in noninfected than in pals1 silenced cells, but no change can be seen when looking at cells individually. All pictures have the same scale. Scale bar, 50 μm. C, D, Noninfected (NI) WB-F344 cells or cells infected with pals1 shRNA 1 and 2 (pals1 sh) or control shRNA (cont sh) were subjected to cell surface biotinylation. The total amount and the amount of biotinylated (biot.) PMP22 (C) and MAG (D) were then analyzed by Western blotting. Two bands corresponding to L-MAG and S-MAG were observed. E, Western blot results were quantified by densitometry, and the relative amount of PMP22, MAG, E-cadherin and integrin β1 at the cell surface in cells silenced for pals1 (pals1 sh1) or not silenced (cont sh) is plotted. The fraction of protein at the cell surface is the ratio of cell surface protein/total protein. Values obtained in silenced cells were normalized to values obtained in nonsilenced cells to obtain the relative amount of protein at the cell surface. In case of MAG, both bands were included in the quantification. AU, Arbitrary unit. Error bars show SEM. n = number of experiments. ns, Not significant.

Similar articles

Cited by

References

    1. Anitei M, Ifrim M, Ewart MA, Cowan AE, Carson JH, Bansal R, Pfeiffer SE. A role for Sec8 in oligodendrocyte morphological differentiation. J Cell Sci. 2006;119:807–818. - PubMed
    1. Balla T, Szentpetery Z, Kim YJ. Phosphoinositide signaling: new tools and insights. Physiology (Bethesda) 2009;24:231–244. - PMC - PubMed
    1. Bolis A, Coviello S, Visigalli I, Taveggia C, Bachi A, Chishti AH, Hanada T, Quattrini A, Previtali SC, Biffi A, Bolino A. Dlg1, Sec8, and Mtmr2 regulate membrane homeostasis in Schwann cell myelination. J Neurosci. 2009;29:8858–8870. - PMC - PubMed
    1. Carracedo A, Pandolfi PP. The PTEN-PI3K pathway: of feedbacks and cross-talks. Oncogene. 2008;27:5527–5541. - PubMed
    1. Chan JR, Jolicoeur C, Yamauchi J, Elliott J, Fawcett JP, Ng BK, Cayouette M. The polarity protein Par-3 directly interacts with p75NTR to regulate myelination. Science. 2006;314:832–836. - PubMed

Publication types