

Performance of common genetic variants in breast-cancer risk models
- PMID: 20237344
- PMCID: PMC2921181
- DOI: 10.1056/NEJMoa0907727
Performance of common genetic variants in breast-cancer risk models
Erratum in
- N Engl J Med. 2010 Dec 2;363(23):2272
Abstract
Background: Genomewide association studies have identified multiple genetic variants associated with breast cancer. The extent to which these variants add to existing risk-assessment models is unknown.
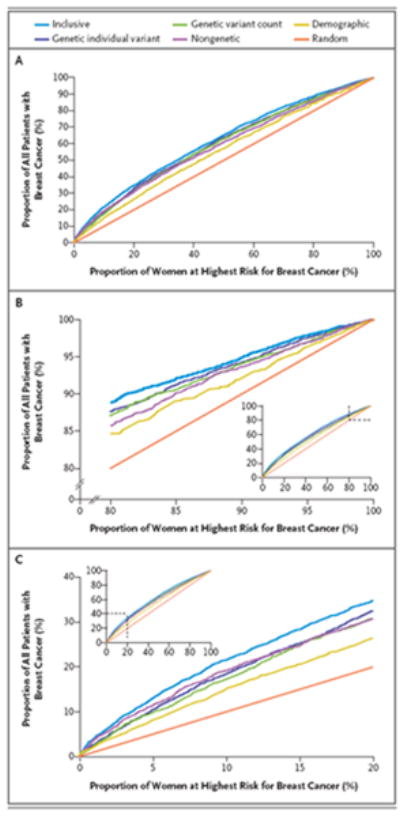
Methods: We used information on traditional risk factors and 10 common genetic variants associated with breast cancer in 5590 case subjects and 5998 control subjects, 50 to 79 years of age, from four U.S. cohort studies and one case-control study from Poland to fit models of the absolute risk of breast cancer. With the use of receiver-operating-characteristic curve analysis, we calculated the area under the curve (AUC) as a measure of discrimination. By definition, random classification of case and control subjects provides an AUC of 50%; perfect classification provides an AUC of 100%. We calculated the fraction of case subjects in quintiles of estimated absolute risk after the addition of genetic variants to the traditional risk model.
Results: The AUC for a risk model with age, study and entry year, and four traditional risk factors was 58.0%; with the addition of 10 genetic variants, the AUC was 61.8%. About half the case subjects (47.2%) were in the same quintile of risk as in a model without genetic variants; 32.5% were in a higher quintile, and 20.4% were in a lower quintile.
Conclusions: The inclusion of newly discovered genetic factors modestly improved the performance of risk models for breast cancer. The level of predicted breast-cancer risk among most women changed little after the addition of currently available genetic information.
2010 Massachusetts Medical Society
Figures
Comment in
-
A tiny step closer to personalized risk prediction for breast cancer.N Engl J Med. 2010 Mar 18;362(11):1043-5. doi: 10.1056/NEJMe0912474. N Engl J Med. 2010. PMID: 20237351 No abstract available.
References
-
- Screening for breast cancer: U.S. Preventive Services Task Force recommendation statement. Ann Intern Med. 2009;151:716–26. - PubMed
-
- ACOG practice bulletin no. 103: hereditary breast and ovarian cancer syndrome. Obstet Gynecol. 2009;113:957–66. - PubMed
-
- Gail MH, Brinton LA, Byar DP, et al. Projecting individualized probabilities of developing breast cancer for white females who are being examined annually. J Natl Cancer Inst. 1989;81:1879–86. - PubMed
-
- Gail MH, Benichou J. Validation studies on a model for breast cancer risk. J Natl Cancer Inst. 1994;86:573–5. Erratum, J Natl Cancer Inst 1994;86:803. - PubMed
Publication types
MeSH terms
Grants and funding
- P01 CA087969/CA/NCI NIH HHS/United States
- N01 WH022110/WH/WHI NIH HHS/United States
- R01 CA49449/CA/NCI NIH HHS/United States
- U01 CA098233/CA/NCI NIH HHS/United States
- U01CA098233/CA/NCI NIH HHS/United States
- U01 CA098710/CA/NCI NIH HHS/United States
- P01 CA53996/CA/NCI NIH HHS/United States
- P01 CA053996/CA/NCI NIH HHS/United States
- P01 CA87969/CA/NCI NIH HHS/United States
- U01CA098710/CA/NCI NIH HHS/United States
- R01 CA049449/CA/NCI NIH HHS/United States
- ZIA CP010188/ImNIH/Intramural NIH HHS/United States
LinkOut - more resources
Full Text Sources
Other Literature Sources
Medical