. 2010 Jun;35(7):1605-17.
doi: 10.1038/npp.2010.33. Epub 2010 Mar 17.

Acute stress impairs hippocampal mossy fiber-CA3 long-term potentiation by enhancing cAMP-specific phosphodiesterase 4 activity

Affiliations

Acute stress impairs hippocampal mossy fiber-CA3 long-term potentiation by enhancing cAMP-specific phosphodiesterase 4 activity

Chien-Chung Chen et al. Neuropsychopharmacology. 2010 Jun.

Abstract

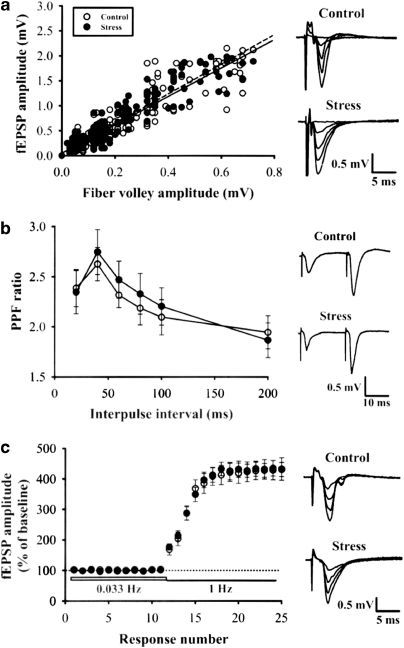
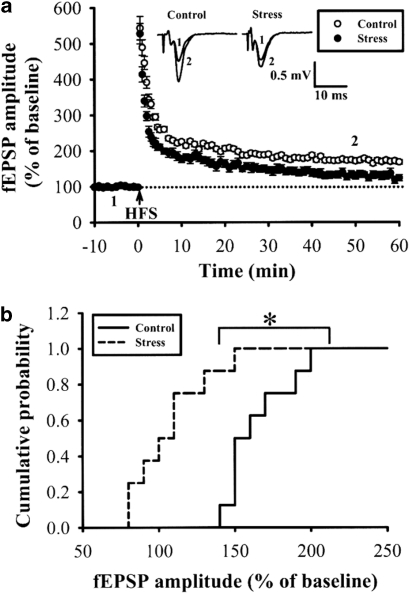
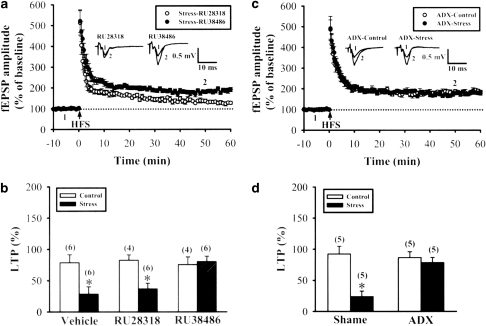
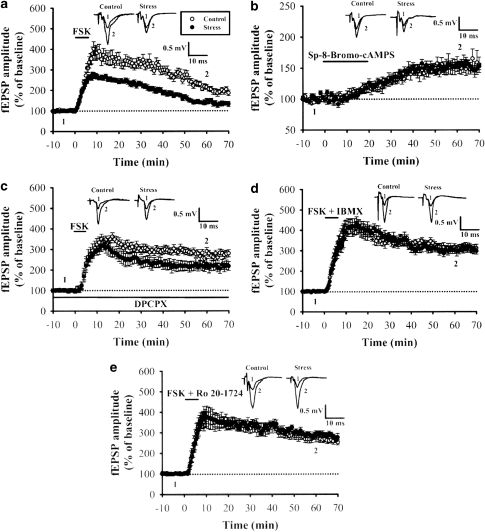
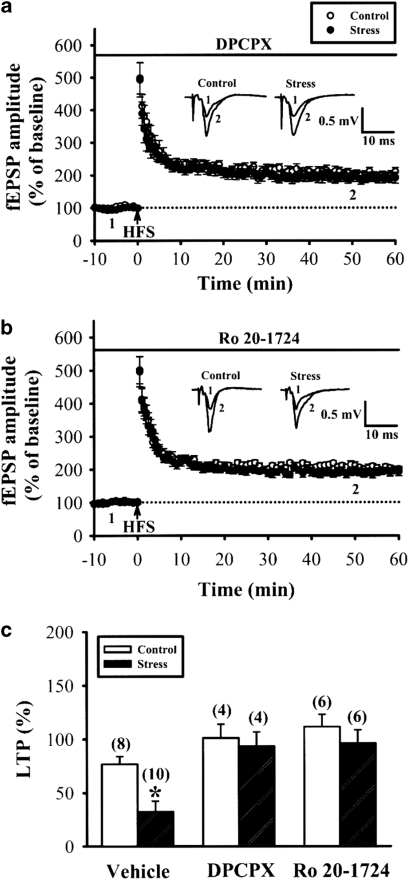
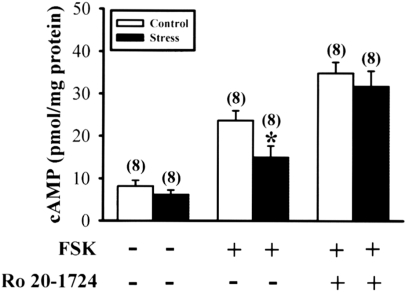
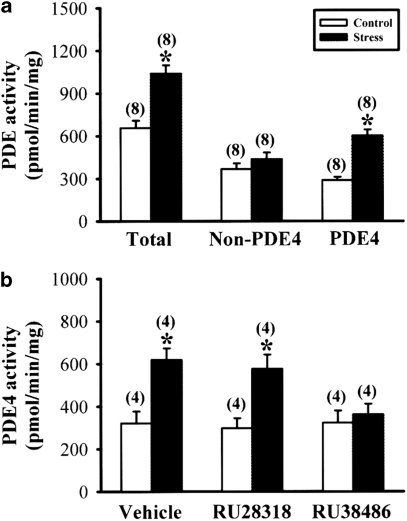
The mossy fiber synapses onto hippocampal CA3 neurons show unique molecular features and a wide dynamic range of plasticity. Although acute stress has been well recognized to alter bidirectional long-term synaptic plasticity in the hippocampal CA1 region and dentate gyrus, it remains unclear whether the same effect may also occur at the mossy fiber-CA3 synapses. Here, we report that hippocampal slices prepared from adult mice that had experienced an acute unpredictable and inescapable restraint tail-shock stress showed a marked impairment of long-term potentiation (LTP) induced by high-frequency stimulation or adenylyl cyclase activator forskolin. This effect was prevented when animals were submitted to bilateral adrenalectomy or given the glucocorticoid receptor antagonist RU38486 before experiencing stress. In contrast, stress has no effect on synaptic potentiation induced by the non-hydrolysable and membrane-permeable cyclic adenosine 5'-monophosphate (cAMP) analog Sp-8-bromo-cAMPS. No obvious differences were observed between control and stressed mice in the basal synaptic transmission, paired-pulse facilitation, or frequency facilitation at the mossy fiber-CA3 synapses. We also found that the inhibitory effect of stress on mossy fiber LTP was obviated by the adenosine A(1) receptor antagonist 8-cyclopentyl-1,3,-dipropylxanthine, the non-specific phosphodiesterase (PDE) inhibitor 3-isobutyl-methylxanthine, and the specific PDE4 inhibitor 4-(3-butoxy-4-methoxyphenyl)methyl-2-imidazolidone. In addition, stress induces a sustained and profound increase in cAMP-specific PDE4 activity. These results suggest that the inhibition of mossy fiber LTP by acute stress treatment seems originating from a corticosterone-induced sustained increase in the PDE4 activity to accelerate the metabolism of cAMP to adenosine, in turn triggering an adenosine A(1) receptor-mediated impairment of transmitter release machinery.


Figures

Figure 1
Figure 1
Basal properties of synaptic transmission are unaltered by acute stress. (a) Input–output curves constructed from the fEPSP amplitude vs the fiber volley amplitude measured at increasing stimulation intensities at the mossy fiber-CA3 synapses of hippocampal slices from control (n=8; open symbols) and stressed (n=8; filled symbols) mice. The superimposed fEPSPs on the right illustrate respective recordings from example experiments. (b) Comparison of PPF ratio in slices from control (n=5; open symbols) and stressed (n=5; filled symbols) mice. The plot summarizes facilitation of the second fEPSP amplitude relative to the first one as a function of the interpulse interval. The fEPSPs on the right illustrate respective recordings from example experiments to paired-pulse stimulation with an interpulse interval of 20 ms. (c) Frequency facilitation measured at 1 Hz stimulation was not significantly changed in slices from stressed mice (n=5; filled symbols) when compared with control mice (n=5; open symbols). Horizontal bars denote the period of the delivery of a series of stimulation at a frequency of 0.033 or 1 Hz. The superimposed fEPSPs on the right illustrate respective recordings from example experiments during 1 Hz stimulation. Error bars indicate SEM.
Figure 2
Figure 2
Stress impairs subsequent LTP induction at the mossy fiber-CA3 synapses. (a) LTP elicited by two trains of 100 Hz stimuli (HFS) with 1 s duration separated by 20 s intertrain interval in the presence D-APV (50 μM). The slices from stressed mice (n=8; filled symbols) displayed a deficit in LTP when compared with those from control mice (n=8; open symbols). (b) Cumulative probability plot showing the distribution of the LTP magnitude, as determined by the mean fEPSP amplitude (normalized to the average baseline value of each slice) at 50 min after HFS for the dataset shown in (a). The superimposed fEPSPs in the inset illustrate respective recordings from example experiments taken at the time indicated by number. The dash lines show level of baseline. Error bars indicate SEM. *p<0.05 Kolmogorov–Smirnov test.
Figure 3
Figure 3
Activation of glucocorticoid receptors mediates the impairment of mossy fiber LTP by acute stress. (a, b) Summary of experiments shows that in slices from stressed mice intraperitoneally injected with glucocorticoid receptor antagonist RU38486 (40 mg/kg) 30 min before stress exposure, two 1-s trains of 100 Hz stimuli induced a reliable LTP that was not significantly different from that observed in slices from the control mice that received vehicle or RU38486 only. In contrast, prior administration of specific mineralocorticoid receptor antagonist RU28318 (10 mg/kg) did not affect the inhibitory effect of stress on LTP induction. (c, d) Summary of experiments shows that stress-induced impairment of LTP was absent in slices from ADX mice when compared with sham-operated mice. The superimposed fEPSPs in the inset illustrate respective recordings from example experiments taken at the time indicated by number. The dash lines show level of baseline. The number in the parenthesis represents the number of animal used. Error bars indicate SEM. *p<0.05 compared with control mice using unpaired Student's t-test.
Figure 4
Figure 4
Stress impairs forskolin-induced LTP at the mossy fiber-CA3 synapses. (a) Summary of experiments shows that the slices from stressed mice displayed a deficit in forskolin (FSK, 25 μM)-induced LTP (n=6; filled symbols) when compared with those from control mice (n=6; open symbols). (b) Summary of experiments shows that the slices from stressed mice displayed a normal Sp-8-bromo-cAMPs (100 μM)-induced LTP (n=5; filled symbols) when compared with those from control mice (n=5; open symbols). (c) Summary of experiments shows that the slices from stressed mice displayed a normal forskolin-induced LTP (n=6; filled symbols) in the presence of adenosine A1 receptor antagonist DPCPX (1 μM) when compared with those from control mice (n=8; open symbols). (d) Summary of experiments shows that co-application of forskolin (25 μM) and IBMX (500 μM) led to a similar LTP in slices from stressed (n=5; filled symbols) and control mice (n=5; open symbols). (e) Summary of experiments shows that co-application of forskolin (25 μM) and Ro 20-1724 (200 μM) led to a similar LTP in slices from stressed (n=6; filled symbols) and control mice (n=4; open symbols). Horizontal bars denote the period of delivery of drugs. The superimposed fEPSPs in the inset illustrate respective recordings from example experiments taken at the time indicated by number. Dash lines show level of baseline. Error bars indicate SEM.
Figure 5
Figure 5
PDE4 signaling mediates the stress-induced impairment of mossy fiber LTP. (a) Summary of experiments shows that the slices from stressed mice displayed a normal HFS-induced LTP (n=4; filled symbols) in the presence of the adenosine A1 receptor antagonist DPCPX (1 μM) when compared with those from control mice (n=4; open symbols). (b) Summary of experiments shows that the slices from stressed mice displayed a normal HFS-induced LTP (n=6; filled symbols) in the presence of the PDE4 blocker Ro 20-1724 (200 μM) when compared with those from control mice (n=6; open symbols). (c) Summary graph compares the effects of vehicle (0.1% DMSO), DPCPX, and Ro 20-1724 on the induction of LTP in slices from control and stressed rats. The magnitude of potentiation was measured 50 min after HFS. Data are taken from (a) and (b). HFS was delivered after sufficient stable baseline recordings in the presence of DPCPX or Ro 20-1724. Horizontal bars denote the period of delivery of drugs. The superimposed fEPSPs in the inset illustrate respective recordings from example experiments taken at the time indicated by number. Dash lines show level of baseline. The number in the parenthesis represents the number of animal used. Error bars indicate SEM. *p<0.05 compared with control mice using unpaired Student's t-test.
Figure 6
Figure 6
Forskolin-stimulated adenylyl cyclase activities in the hippocampal CA3 synaptosomes from control and stressed mice. A summary bar graph shows that the inhibitory effect of stress on forskolin (25 μM)-stimulated cAMP production was blocked in the presence of Ro 20-1724 (200 μM). The number in the parenthesis represents the number of animal used. Error bars indicate SEM. *p<0.05 compared with control mice using unpaired Student's t-test.
Figure 7
Figure 7
The total PDE, non-PDE4, and PDE4 activities in the hippocampal CA3 slices from control and stressed mice. (a) A summary bar graph shows that stress significantly increased the PDE4 activity, but not non-PDE4 activity. (b) A summary bar graph shows that stress-induced increase in PDE4 activity was specifically blocked by RU38486 (40 mg/kg) administration 30 min before stress exposure. In contrast, prior administration of RU28318 (10 mg/kg) had no effect on the stress-induced increase in PDE4 activity. PDE4 activity was obtained by subtracting the non-PDE4 (ie rolipram-insensitive PDE) activity from the total PDE activity. The number in the parenthesis represents the number of animal used. Error bars indicate SEM. *p<0.05 compared with control mice using unpaired Student's t-test.

Similar articles

Cited by

References

    1. Ahmed T, Frey JU, Korz V. Long-term effects of brief acute stress on cellular signaling and hippocampal LTP. J Neurosci. 2006;26:3951–3958. - PMC - PubMed
    1. Alzheimer C, Röhrenbeck J, ten Bruggencate G. Adenosine depresses induction of LTP at the mossy fiber-CA3 synapse in vitro. Brain Res. 1991;543:163–165. - PubMed
    1. Baillie GS, MacKenzie SJ, McPhee I, Houslay MD. Sub-family selective actions in the ability of Erk2 MAP kinase to phosphorylate and regulate the activity of PDE4 cyclic AMP-specific phosphodiesterases. Br J Pharmacol. 2000;131:811–819. - PMC - PubMed
    1. Bains JS, Longacher JM, Staley KJ. Reciprocal interactions between CA3 network activity and strength of recurrent collateral synapses. Nat Neurosci. 1999;2:720–726. - PubMed
    1. Bruns RF, Lu GH, Pugsley TA. Characterization of the A2 adenosine receptor labeled by [3H]NECA in rat striatal membranes. Mol Pharmacol. 1986;29:331–346. - PubMed

Publication types

MeSH terms