

Daily intake of bisphenol A and potential sources of exposure: 2005-2006 National Health and Nutrition Examination Survey
- PMID: 20237498
- PMCID: PMC3079892
- DOI: 10.1038/jes.2010.9
Daily intake of bisphenol A and potential sources of exposure: 2005-2006 National Health and Nutrition Examination Survey
Abstract
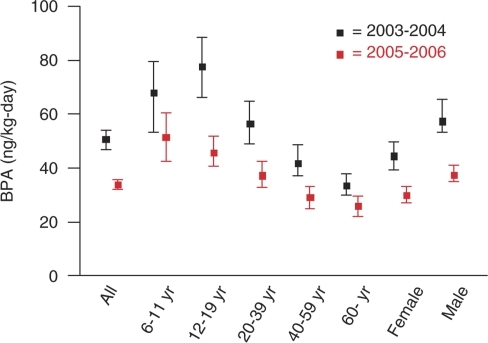
Nationally representative data on urinary levels of bisphenol A (BPA) and its metabolites in the United States from the 2005-2006 National Health and Nutrition Examination Survey (NHANES) were used to estimate daily BPA intakes. In addition, NHANES data on potential sources of BPA exposure and personal characteristics were explored for their association with urinary BPA levels. On the basis of 2005-2006 NHANES urinary BPA data and assumptions described in this paper, median daily intake for the overall population is approximately 34 ng/kg-day. Median daily BPA intakes for men are statistically significantly higher than for women; there is a significant decrease in daily BPA intake with increasing age. Gender- and age-specific median intakes differ from the overall population by less than a factor of 2. Although estimates of daily BPA intake have decreased compared with those from the 2003-2004 NHANES, it is premature to draw conclusions regarding trends at this time, as there is no indication that BPA use declined from 2003 to 2006. On the basis of an assessment of urinary BPA and questionnaire data from the 2005-2006 NHANES, consumption of soda, school lunches, and meals prepared outside the home--but not bottled water or canned tuna--was statistically significantly associated with higher urinary BPA.
Figures
Similar articles
-
Temporal trends in bisphenol A exposure in the United States from 2003-2012 and factors associated with BPA exposure: Spot samples and urine dilution complicate data interpretation.Environ Res. 2015 Oct;142:84-95. doi: 10.1016/j.envres.2015.06.013. Epub 2015 Jun 26. Environ Res. 2015. PMID: 26121292
-
Bisphenol A (BPA) daily intakes in the United States: estimates from the 2003-2004 NHANES urinary BPA data.J Expo Sci Environ Epidemiol. 2008 Nov;18(6):608-15. doi: 10.1038/jes.2008.20. Epub 2008 Apr 16. J Expo Sci Environ Epidemiol. 2008. PMID: 18414515
-
Factors affecting interpretation of national biomonitoring data from multiple countries: BPA as a case study.Environ Res. 2019 Jun;173:318-329. doi: 10.1016/j.envres.2019.03.047. Epub 2019 Mar 26. Environ Res. 2019. PMID: 30951958
-
A systematic review of Bisphenol A "low dose" studies in the context of human exposure: a case for establishing standards for reporting "low-dose" effects of chemicals.Food Chem Toxicol. 2013 Dec;62:935-48. doi: 10.1016/j.fct.2013.07.007. Epub 2013 Jul 16. Food Chem Toxicol. 2013. PMID: 23867546
-
Bisphenol A and human health: a review of the literature.Reprod Toxicol. 2013 Dec;42:132-55. doi: 10.1016/j.reprotox.2013.08.008. Epub 2013 Aug 30. Reprod Toxicol. 2013. PMID: 23994667 Review.
Cited by
-
Environmental levels of oestrogenic and antiandrogenic compounds feminize digit ratios in male rats and their unexposed male progeny.Proc Biol Sci. 2013 Aug 7;280(1768):20131532. doi: 10.1098/rspb.2013.1532. Print 2013 Oct 7. Proc Biol Sci. 2013. PMID: 23926155 Free PMC article.
-
Early exposure to bisphenol A alters neuron and glia number in the rat prefrontal cortex of adult males, but not females.Neuroscience. 2014 Oct 24;279:122-31. doi: 10.1016/j.neuroscience.2014.08.038. Epub 2014 Sep 1. Neuroscience. 2014. PMID: 25193849 Free PMC article.
-
High-Content Image-Based Single-Cell Phenotypic Analysis for the Testicular Toxicity Prediction Induced by Bisphenol A and Its Analogs Bisphenol S, Bisphenol AF, and Tetrabromobisphenol A in a Three-Dimensional Testicular Cell Co-culture Model.Toxicol Sci. 2020 Feb 1;173(2):313-335. doi: 10.1093/toxsci/kfz233. Toxicol Sci. 2020. PMID: 31750923 Free PMC article.
-
Update on the Health Effects of Bisphenol A: Overwhelming Evidence of Harm.Endocrinology. 2021 Mar 1;162(3):bqaa171. doi: 10.1210/endocr/bqaa171. Endocrinology. 2021. PMID: 33516155 Free PMC article. Review.
-
The effect of bisphenol A on some oxidative stress parameters and acetylcholinesterase activity in the heart of male albino rats.Cytotechnology. 2015 Jan;67(1):145-55. doi: 10.1007/s10616-013-9672-1. Epub 2013 Dec 12. Cytotechnology. 2015. PMID: 24337652 Free PMC article.
References
-
- Becker K., Güen T., Seiwert M., Conrad A., Pick-Fuss H., Müller J., Wittassek M., Schulz C., Kolossa-Gehring M. GerES IV: phthalate metabolites and bisphenol A in urine of German children. Int J Hyg Environ Health. 2009;212:685–692. - PubMed
-
- Cao X.L., Corriveau J., Popovic S. Levels of bisphenol A in canned soft drink products in Canadian markets. J Agric Food Chem. 2009;57:1307–1311. - PubMed
Publication types
MeSH terms
Substances
LinkOut - more resources
Full Text Sources
