

Indirect imaging of cardiac-specific transgene expression using a bidirectional two-step transcriptional amplification strategy
- PMID: 20237511
- PMCID: PMC2900530
- DOI: 10.1038/gt.2010.30
Indirect imaging of cardiac-specific transgene expression using a bidirectional two-step transcriptional amplification strategy
Abstract
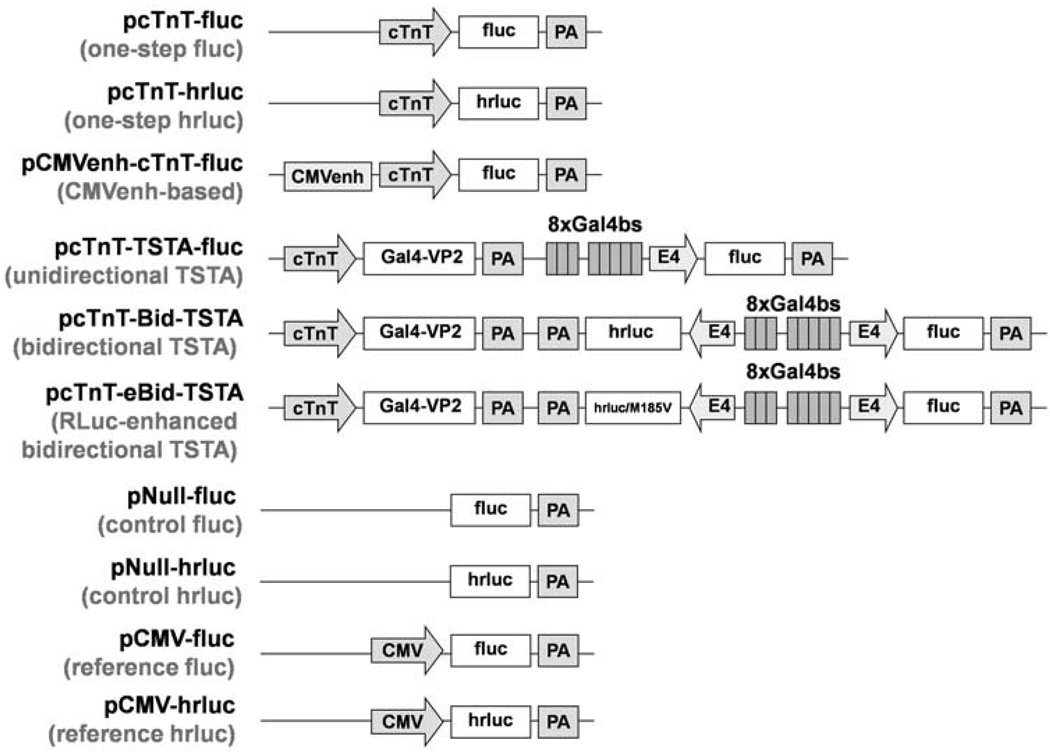
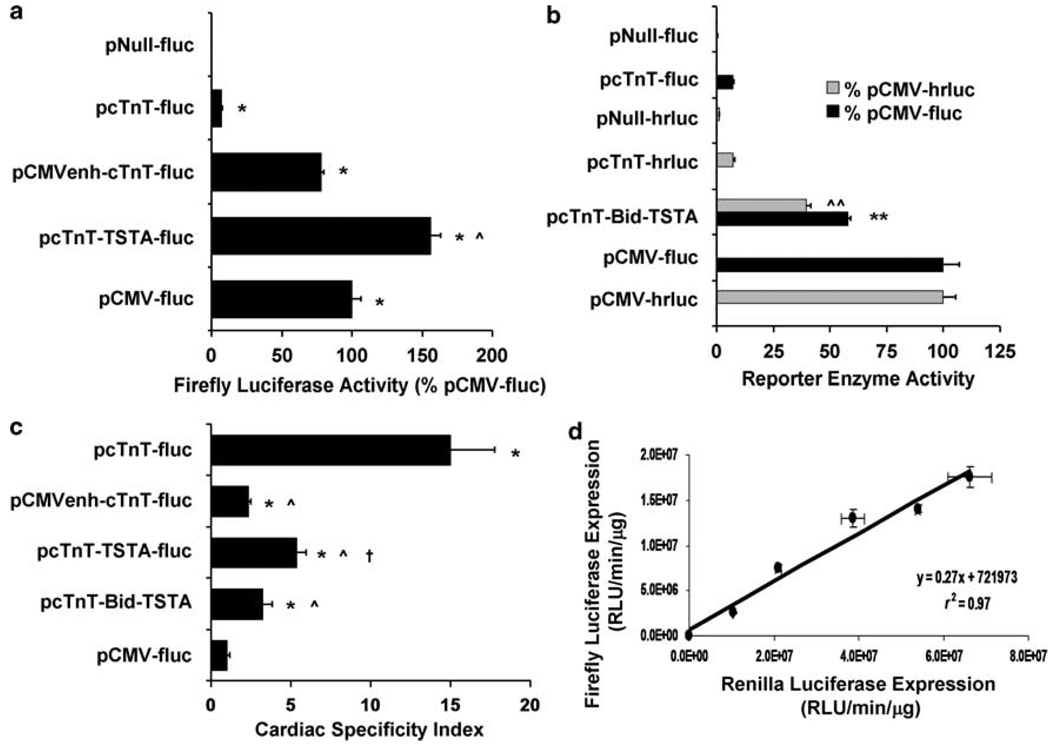
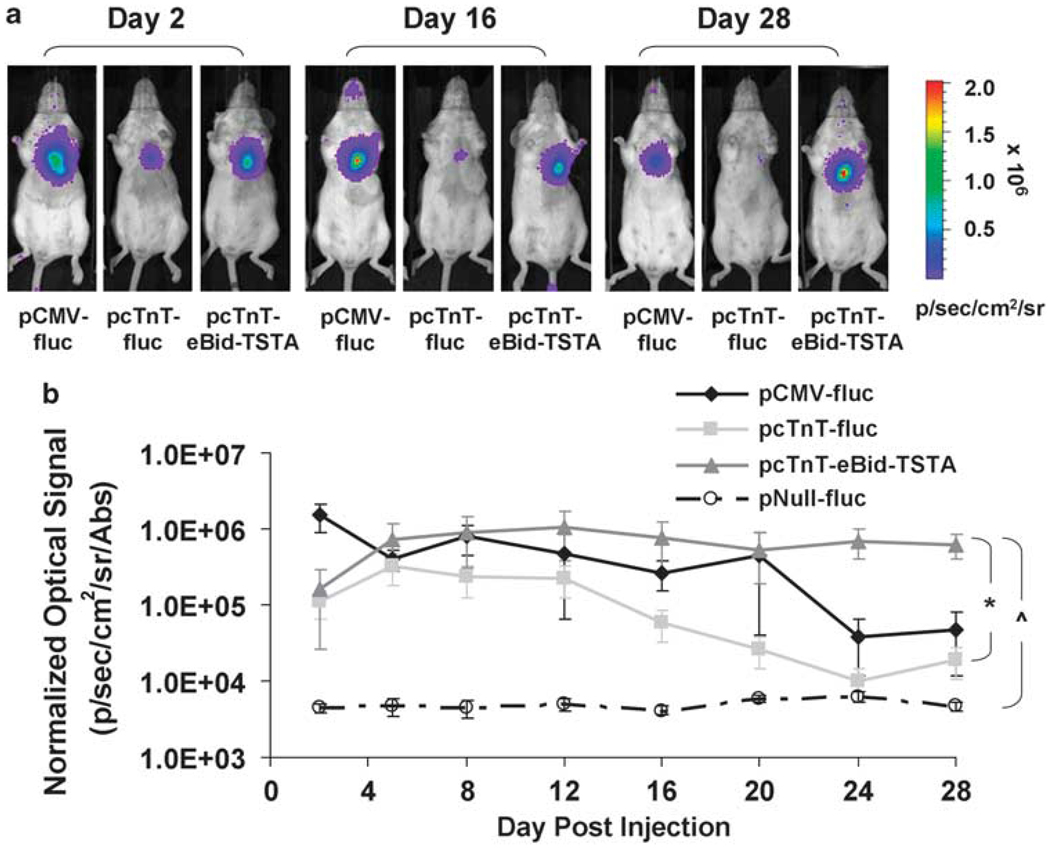
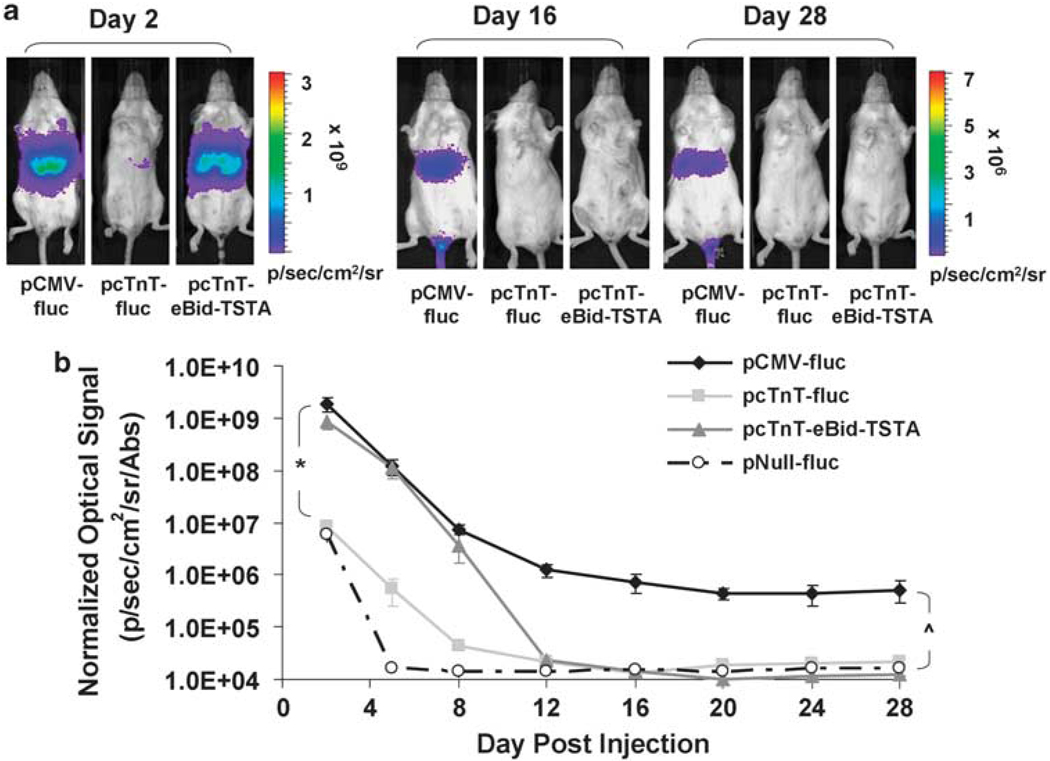
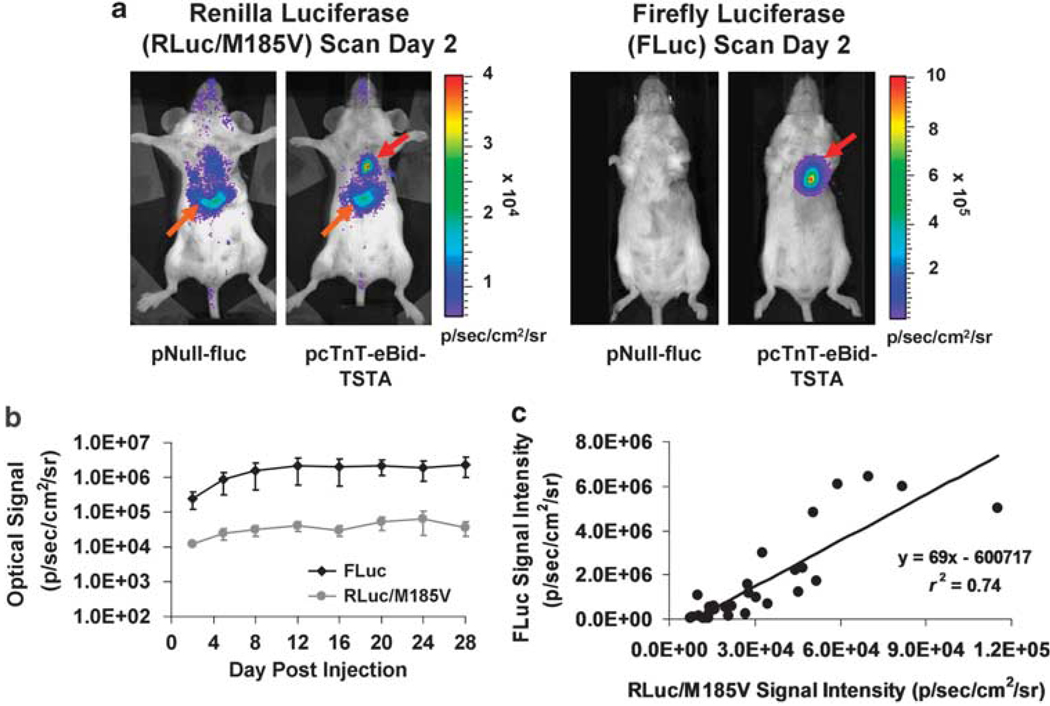
Transcriptional targeting for cardiac gene therapy is limited by the relatively weak activity of most cardiac-specific promoters. We have developed a bidirectional plasmid vector, which uses a two-step transcriptional amplification (TSTA) strategy to enhance the expression of two optical reporter genes, firefly luciferase (fluc) and Renilla luciferase (hrluc), driven by the cardiac troponin T (cTnT) promoter. The vector was characterized in vitro and in living mice using luminometry and bioluminescence imaging to assess its ability to mediate strong, correlated reporter gene expression in a cardiac cell line and the myocardium, while minimizing expression in non-cardiac cell lines and the liver. In vitro, the TSTA system significantly enhanced cTnT-mediated reporter gene expression with moderate preservation of cardiac specificity. After intramyocardial and hydrodynamic tail vein delivery of an hrluc-enhanced variant of the vector, long-term fluc expression was observed in the heart, but not in the liver. In both the cardiac cell line and the myocardium, fluc expression correlated well with hrluc expression. These results show the vector's ability to effectively amplify and couple transgene expression in a cardiac-specific manner. Further replacement of either reporter gene with a therapeutic gene should allow non-invasive imaging of targeted gene therapy in living subjects.
Conflict of interest statement
The authors declare no conflict of interest.
Figures
Similar articles
-
Noninvasive imaging of hypoxia-inducible factor-1α gene therapy for myocardial ischemia.Hum Gene Ther Methods. 2013 Oct;24(5):279-88. doi: 10.1089/hgtb.2013.028. Hum Gene Ther Methods. 2013. PMID: 23937265 Free PMC article.
-
A titratable two-step transcriptional amplification strategy for targeted gene therapy based on ligand-induced intramolecular folding of a mutant human estrogen receptor.Mol Imaging Biol. 2014 Apr;16(2):224-34. doi: 10.1007/s11307-013-0673-4. Mol Imaging Biol. 2014. PMID: 23955099 Free PMC article.
-
Novel bidirectional vector strategy for amplification of therapeutic and reporter gene expression.Hum Gene Ther. 2004 Jul;15(7):681-90. doi: 10.1089/1043034041361271. Hum Gene Ther. 2004. PMID: 15242528 Free PMC article.
-
Strategies of conditional gene expression in myocardium: an overview.Methods Mol Med. 2005;112:109-54. doi: 10.1007/978-1-59259-879-3_8. Methods Mol Med. 2005. PMID: 16010014 Review.
-
Factors modulating expression of Renilla luciferase from control plasmids used in luciferase reporter gene assays.Anal Biochem. 2010 Jan 15;396(2):167-72. doi: 10.1016/j.ab.2009.09.043. Epub 2009 Sep 27. Anal Biochem. 2010. PMID: 19788887 Free PMC article. Review.
Cited by
-
In vivo imaging of intraprostatic-specific gene transcription by PET.J Nucl Med. 2011 May;52(5):784-91. doi: 10.2967/jnumed.110.084582. Epub 2011 Apr 15. J Nucl Med. 2011. PMID: 21498525 Free PMC article.
-
Positron emission tomography reporter genes and reporter probes: gene and cell therapy applications.Theranostics. 2012;2(4):374-91. doi: 10.7150/thno.3677. Epub 2012 Apr 10. Theranostics. 2012. PMID: 22509201 Free PMC article.
-
Susceptibility of murine induced pluripotent stem cell-derived cardiomyocytes to hypoxia and nutrient deprivation.Stem Cell Res Ther. 2015 Apr 23;6(1):83. doi: 10.1186/s13287-015-0057-6. Stem Cell Res Ther. 2015. PMID: 25900017 Free PMC article.
-
Noninvasive monitoring of oxidative stress in transplanted mesenchymal stromal cells.JACC Cardiovasc Imaging. 2013 Jul;6(7):795-802. doi: 10.1016/j.jcmg.2012.11.018. Epub 2013 May 1. JACC Cardiovasc Imaging. 2013. PMID: 23643284 Free PMC article.
-
Noninvasive imaging of hypoxia-inducible factor-1α gene therapy for myocardial ischemia.Hum Gene Ther Methods. 2013 Oct;24(5):279-88. doi: 10.1089/hgtb.2013.028. Hum Gene Ther Methods. 2013. PMID: 23937265 Free PMC article.
References
-
- Rissanen TT, Yla-Herttuala S. Current status of cardiovascular gene therapy. Mol Ther. 2007;15:1233–1247. - PubMed
-
- Raper SE, Chirmule N, Lee FS, Wivel NA, Bagg A, Gao GP, et al. Fatal systemic inflammatory response syndrome in a ornithine transcarbamylase deficient patient following adenoviral gene transfer. Mol Genet Metab. 2003;80:148–158. - PubMed
-
- Gaspar HB, Thrasher AJ. Gene therapy for severe combined immunodeficiencies. Expert Opin Biol Ther. 2005;5:1175–1182. - PubMed
-
- Franz WM, Rothmann T, Frey N, Katus HA. Analysis of tissue-specific gene delivery by recombinant adenoviruses containing cardiac-specific promoters. Cardiovasc Res. 1997;35:560–566. - PubMed
-
- Huard J, Lochmüller H, Acsadi G, Jani A, Massie B, Karpati G. The route of administration is a major determinant of the transduction efficiency of rat tissues by adenoviral recombinants. Gene Ther. 1995;2:107–115. - PubMed
Publication types
MeSH terms
Substances
Grants and funding
LinkOut - more resources
Full Text Sources
Research Materials
