

Web-based analysis of (Epi-) genome data using EpiGRAPH and Galaxy
- PMID: 20238087
- PMCID: PMC6529944
- DOI: 10.1007/978-1-60327-367-1_15
Web-based analysis of (Epi-) genome data using EpiGRAPH and Galaxy
Abstract
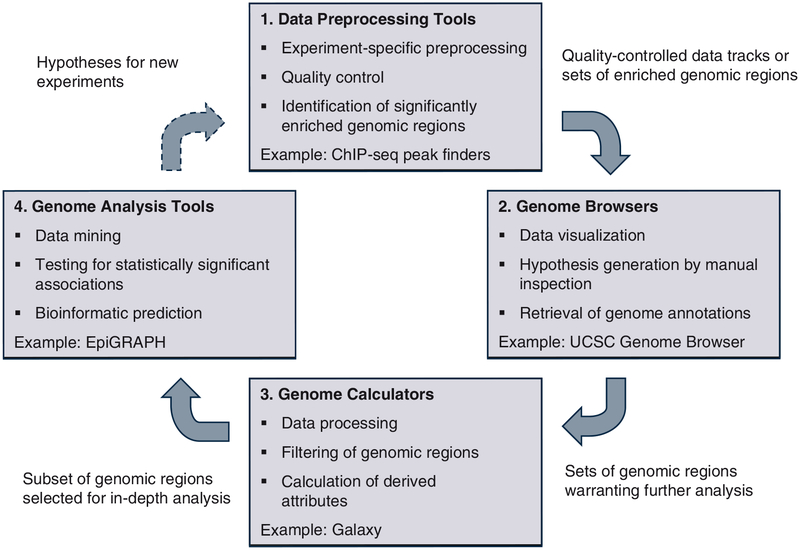
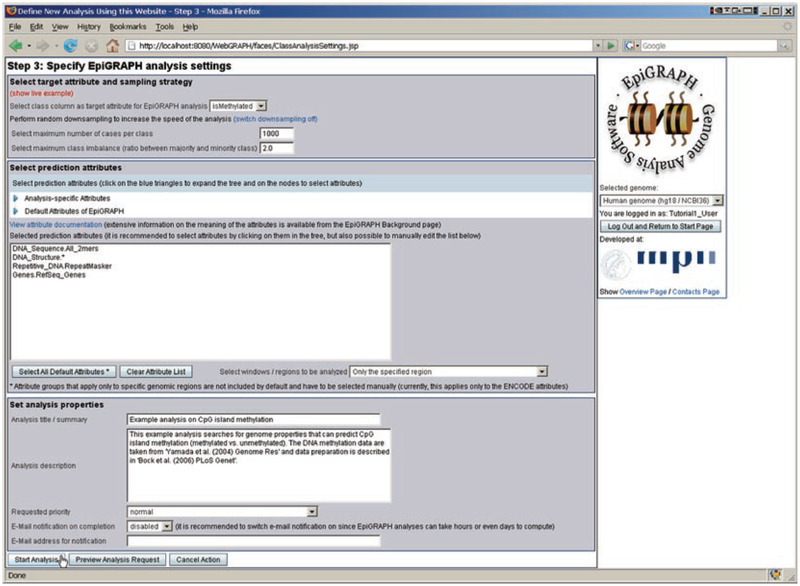
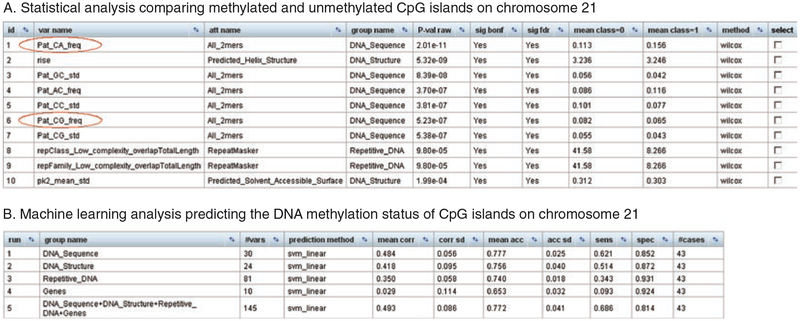
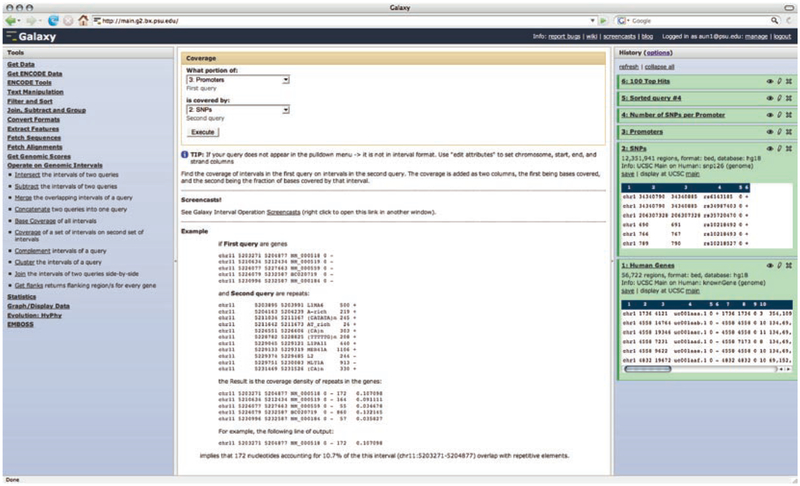
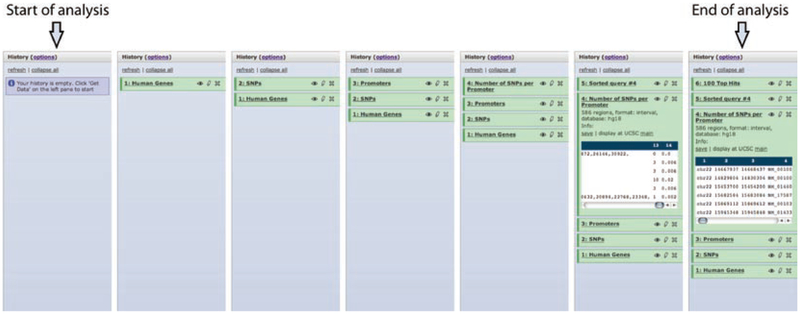
Modern life sciences are becoming increasingly data intensive, posing a significant challenge for most researchers and shifting the bottleneck of scientific discovery from data generation to data analysis. As a result, progress in genome research is increasingly impeded by bioinformatic hurdles. A new generation of powerful and easy-to-use genome analysis tools has been developed to address this issue, enabling biologists to perform complex bioinformatic analyses online - without having to learn a programming language or downloading and manually processing large datasets. In this tutorial paper, we describe the use of EpiGRAPH (http://epigraph.mpi-inf.mpg.de/) and Galaxy (http://galaxyproject.org/) for genome and epigenome analysis, and we illustrate how these two web services work together to identify epigenetic modifications that are characteristics of highly polymorphic (SNP-rich) promoters. This paper is supplemented with video tutorials (http://tinyurl.com/yc5xkqq), which provide a step-by-step guide through each example analysis.
Figures

Similar articles
-
EpiGRAPH: user-friendly software for statistical analysis and prediction of (epi)genomic data.Genome Biol. 2009 Feb 10;10(2):R14. doi: 10.1186/gb-2009-10-2-r14. Genome Biol. 2009. PMID: 19208250 Free PMC article.
-
Using Galaxy to Perform Large-Scale Interactive Data Analyses-An Update.Curr Protoc. 2021 Feb;1(2):e31. doi: 10.1002/cpz1.31. Curr Protoc. 2021. PMID: 33583104
-
Analyzing epigenome data in context of genome evolution and human diseases.Methods Mol Biol. 2012;856:431-67. doi: 10.1007/978-1-61779-585-5_18. Methods Mol Biol. 2012. PMID: 22399470
-
Current bioinformatics tools in genomic biomedical research (Review).Int J Mol Med. 2006 Jun;17(6):967-73. Int J Mol Med. 2006. PMID: 16685403 Review.
-
An integrated workflow for DNA methylation analysis.J Genet Genomics. 2013 May 20;40(5):249-60. doi: 10.1016/j.jgg.2013.03.010. Epub 2013 Mar 30. J Genet Genomics. 2013. PMID: 23706300 Review.
Cited by
-
Next generation sequencing based approaches to epigenomics.Brief Funct Genomics. 2010 Dec;9(5-6):455-65. doi: 10.1093/bfgp/elq035. Brief Funct Genomics. 2010. PMID: 21266347 Free PMC article. Review.
-
Gene expression and nucleotide composition are associated with genic methylation level in Oryza sativa.BMC Bioinformatics. 2014 Jan 21;15:23. doi: 10.1186/1471-2105-15-23. BMC Bioinformatics. 2014. PMID: 24447369 Free PMC article.
-
Exploratory analysis of genomic segmentations with Segtools.BMC Bioinformatics. 2011 Oct 26;12:415. doi: 10.1186/1471-2105-12-415. BMC Bioinformatics. 2011. PMID: 22029426 Free PMC article.
-
Integrating diverse databases into an unified analysis framework: a Galaxy approach.Database (Oxford). 2011 Apr 29;2011:bar011. doi: 10.1093/database/bar011. Print 2011. Database (Oxford). 2011. PMID: 21531983 Free PMC article.
-
Putting epigenome comparison into practice.Nat Biotechnol. 2010 Oct;28(10):1053-6. doi: 10.1038/nbt1010-1053. Nat Biotechnol. 2010. PMID: 20944597 Free PMC article.
References
-
- Bernstein BE, Meissner A and Lander ES (2007) The mammalian epigenome. Cell, 128, 669–681. - PubMed
-
- Chen K and Rajewsky N (2007) The evolution of gene regulation by transcription factors and microRNAs. Nat. Rev. Genet, 8, 93–103. - PubMed
-
- Zhang MQ (2005) In: Pal SK (ed.), PReMI. Springer-Verlag; Berlin Heidelberg, Vol. 3776, pp. 31–38.
-
- Frigola J, Song J, Stirzaker C, Hinshelwood RA, Peinado MA and Clark SJ (2006) Epigenetic remodeling in colorectal cancer results in coordinate gene suppression across an entire chromosome band. Nat. Genet, 38, 540–549. - PubMed
-
- Feinberg AP (2007) Phenotypic plasticity and the epigenetics of human disease. Nature, 447, 433–440. - PubMed
Publication types
MeSH terms
Grants and funding
LinkOut - more resources
Full Text Sources
Research Materials
