

How healthy could a state be?
- PMID: 20297741
- PMCID: PMC2821842
- DOI: 10.1177/003335491012500203
How healthy could a state be?
Abstract
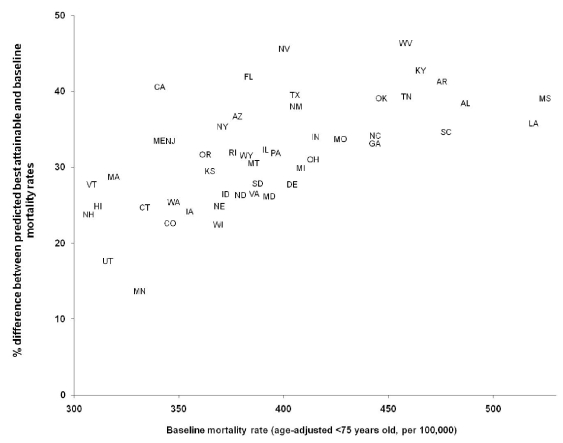
Objective: We predicted the amount of health outcome improvement any state might achieve if it could reach the highest level of key health determinants any individual state has already achieved.
Methods: Using secondary county-level data on modifiable and nonmodifiable health determinants from 1994 to 2003, we used regression analysis to predict state age-adjusted mortality rates in 2000 for those younger than age 75, under the scenario of each state's "ideal" predicted mortality if that state had the best observed level among all states of modifiable determinants.
Results: We found considerable variation in predicted improvement across the states. The state with the lowest baseline mortality, New Hampshire, was predicted to improve by 23% to a mortality rate of 250 per 100,000 population if New Hampshire had the most favorable profile of modifiable health determinants. However, West Virginia, with a much higher baseline, would be predicted to improve the most-by 46% to 254 per 100,000 population. Individual states varied in the pattern of specific modifiable variables associated with their predicted improvement.
Conclusions: The results support the contention that health improvement requires investment in three major categories: health care, behavioral change, and socioeconomic factors. Different states will require different investment portfolios depending on their pattern of modifiable and nonmodifiable determinants.
Figures
Comment in
-
The politics of achievable mortality.Public Health Rep. 2010 Mar-Apr;125(2):168-70. doi: 10.1177/003335491012500204. Public Health Rep. 2010. PMID: 20297742 Free PMC article. No abstract available.
References
-
- Evans RG, Stoddart GL. Consuming health care, producing health. Soc Sci Med. 1990;33:1347–63. - PubMed
-
- Holland WW, editor. 3rd ed. Oxford: Oxford University Press; 1997. European community atlas of avoidable death 1985–89.
-
- Hahn RA, Teutsch SM, Rothenberg RB, Marks JS. Excess deaths from nine chronic diseases in the United States, 1986. JAMA. 1990;264:2654–9. - PubMed
-
- Weisz D, Gusmano MK, Rodwin VG, Neuberg LG. Population health and the health system: a comparative analysis of avoidable mortality in three nations and their world cities. Eur J Public Health. 2008;18:166–72. - PubMed
-
- McGinnis JM, Williams-Russo P, Knickman JR. The case for more active policy attention to health promotion. Health Aff (Millwood) 2002;21:78–93. - PubMed
Publication types
MeSH terms
LinkOut - more resources
Full Text Sources
Medical
