. 2010 May 6:1329:36-44.
doi: 10.1016/j.brainres.2010.03.025. Epub 2010 Mar 16.

Organophosphate exposure during a critical developmental stage reprograms adenylyl cyclase signaling in PC12 cells

Affiliations

Organophosphate exposure during a critical developmental stage reprograms adenylyl cyclase signaling in PC12 cells

Abayomi A Adigun et al. Brain Res. .

Abstract

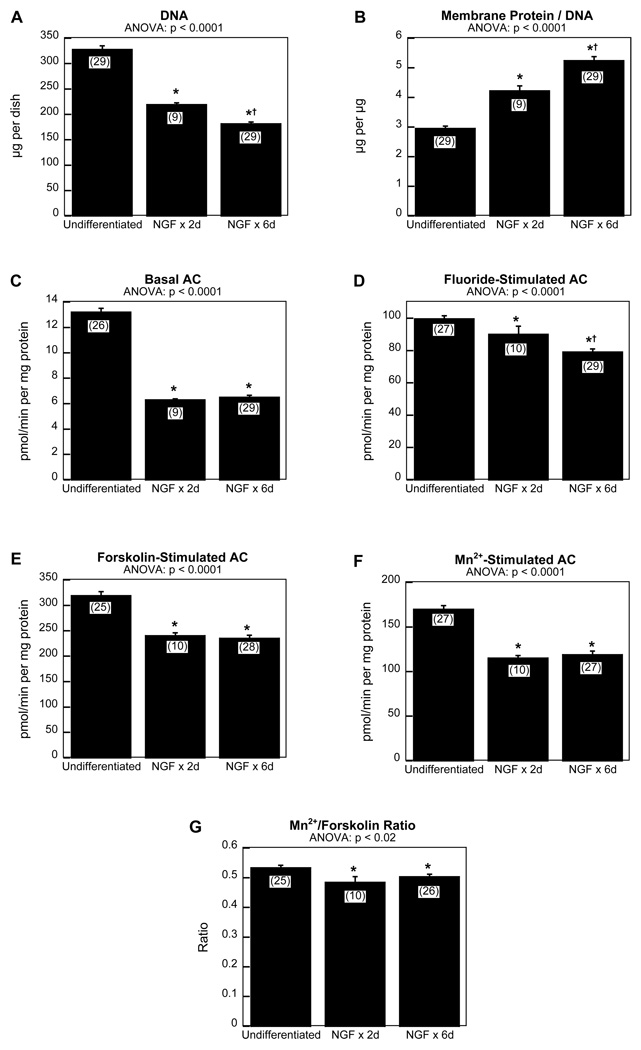
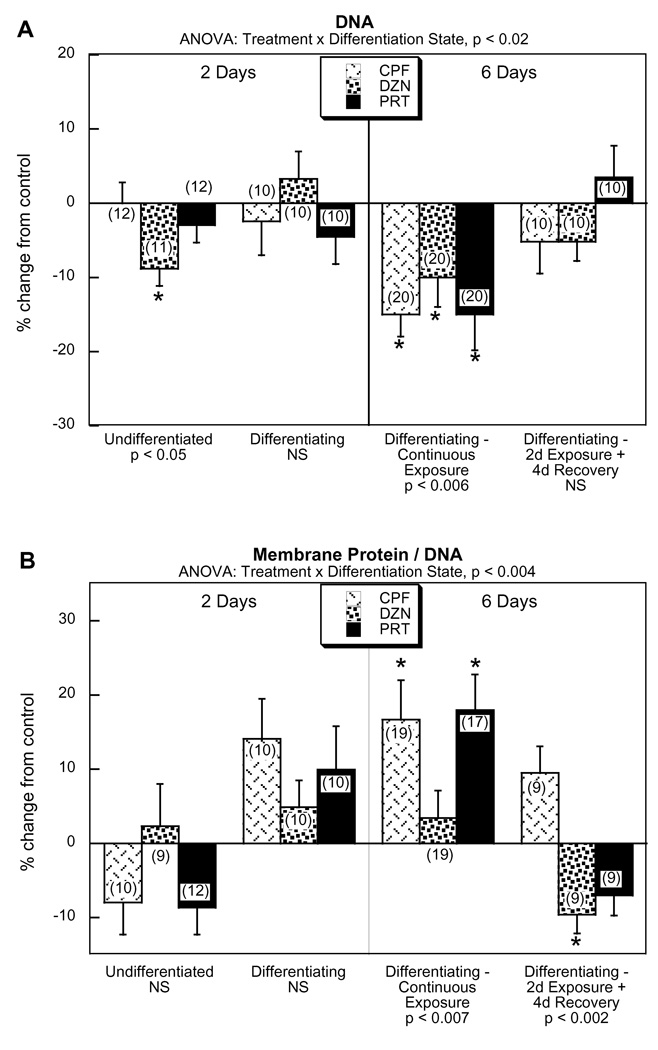
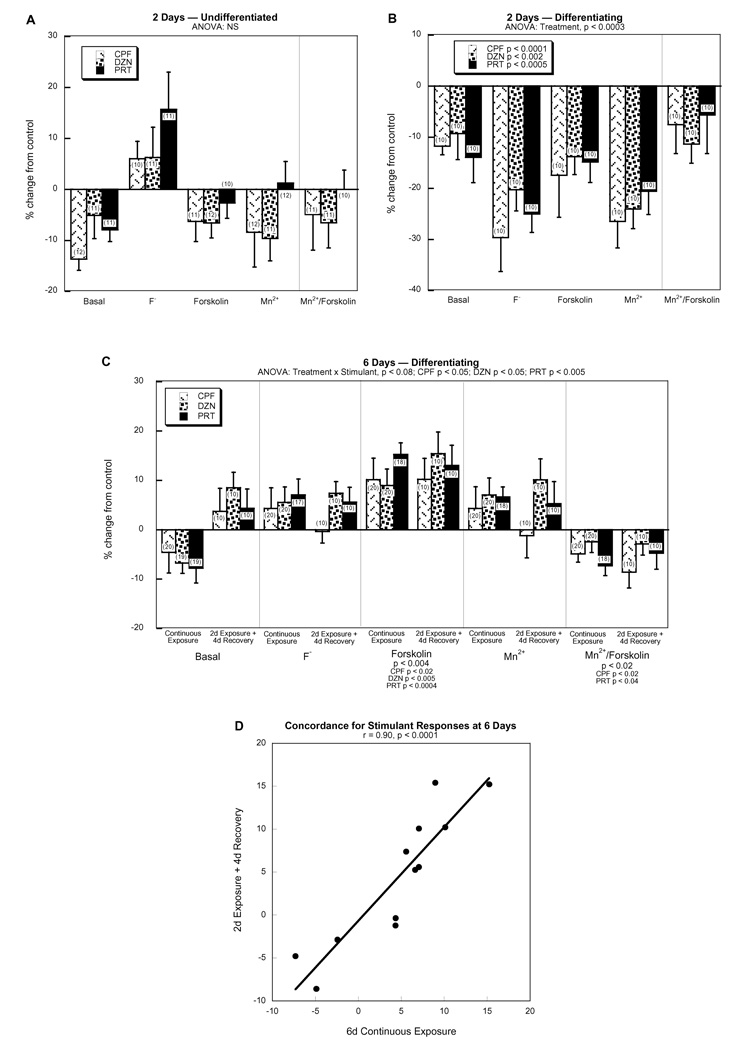
Early-life organophosphate (OP) exposures elicit neurobehavioral deficits through mechanisms other than inhibiting cholinesterase. Cell signaling cascades are postulated as critical noncholinesterase targets that mediate both the initial alterations in neurodevelopment as well as subsequent abnormalities of synaptic function. We exposed PC12 cells to chlorpyrifos, diazinon or parathion in the undifferentiated state and during neurodifferentiation; we then assessed the function of the adenylyl cyclase (AC) signaling cascade, measuring basal AC activity as well as responses to stimulants acting at G-proteins or on the AC molecule itself. In undifferentiated cells, a 2day exposure to the OPs had no significant effect on AC signaling but the same treatment in differentiating cells produced deficits in all AC measures when exposure commenced at the initiation of differentiation. However, when exposure of the differentiating cells was continued for 6days, AC activities then became supranormal. The same increase was obtained if cells were exposed only for the first two days of differentiation, followed by four subsequent days without the OPs. Furthermore, the OP effects on cell signaling were entirely distinct from those on indices of cell number and neurite outgrowth. These results indicate that OP exposure reprograms the AC pathway during a discrete developmental stage at the commencement of neurodifferentiation, with effects that continue to emerge after OP exposure is discontinued. Importantly, the same sequence is seen with OP exposures in neonatal rats, indicating that direct effects of these agents to reprogram cell signaling provide a major mechanism for functional effects unrelated to cholinesterase inhibition.


Conflict of interest statement

Conflicts of Interest: TAS has provided expert witness testimony in the past three years at the behest of the following law firms: The Calwell Practice (Charleston WV), Frost Brown Todd (Charleston WV), Weltchek Mallahan & Weltchek (Lutherville MD), Finnegan Henderson Farabow Garrett & Dunner (Washington DC), Frommer Lawrence Haug (Washington DC), Carter Law (Peoria IL), Corneille Law (Madison WI), Angelos Law (Baltimore MD), Kopff, Nardelli & Dopf (New York NY), Gutglass Erickson Bonville & Larson (Madison WI) and Pardieck Law (Seymour IN).

Figures

Figure 1
Figure 1. Effects of NGF on parameters of cell growth and AC signaling
(A) DNA, (B) membrane protein/DNA ratio, (C) basal AC, (D) fluoride-stimulated AC, (E) forskolin-stimulated AC, (F) Mn2+-stimulated AC, and (G) Mn2+/forskolin ratio. Cells were cultured for a total of 7 days. NGF was introduced after either 5 days in culture (2 days of NGF treatment, NGF × 2d) or after 1 day in culture (6 days of NGF treatment, NGF × 6d). Data represent means and standard errors of the number of determinations shown in parentheses. ANOVA appears above each panel; asterisks denote values for differentiating cells that differ from the undifferentiated state and daggers denote differences between 2 days and 6 days of NGF exposure. The values shown here were normalized and pooled from the control groups across all experiments; however organophosphate treatment effects in the remaining figures were assessed against only the matched contemporaneous controls for each study.
Figure 2
Figure 2. Effects of OP exposure on cell growth parameters
(A) DNA, (B) membrane protein/DNA ratio. Data represent means and standard errors of the number of determinations shown in parentheses, given as the percentage change from control values. ANOVA appears above each panel and lower-order tests for each differentiation state appear at the bottom. Asterisks denote individual values that differ significantly from the corresponding control. Abbreviation: NS, not significant.
Figure 3
Figure 3. Effects of OP exposure on AC activities
(A) undifferentiated cells with a 2 day exposure, (B) differentiating cells with a 2 day exposure, (C) differentiating cells with a 6 day continuous exposure or with a 2 day exposure followed by a 4 day recovery period. Data represent means and standard errors of the number of determinations shown in parentheses, given as the percentage change from control values. A global ANOVA incorporating all variables and dependent measures in a single test identified a main treatment effect (p < 0.02) and interactions of treatment × differentiation state (p < 0.0007) and treatment × state × stimulant (p < 0.03), necessitating subdivision into the individual differentiation states (A,B,C). Accordingly, separate ANOVAs for each differentiation state appear above the panels. Lower order tests were not carried out for (A) and (B) because of the absence of treatment interactions with other variables; in (B), the main effects for each OP are shown within the legend box. In (C), the treatment × stimulant interaction necessitated separate examinations for each stimulant condition and the corresponding ANOVAs are shown below the panel; main effects for each OP are shown without conducting separate tests for each exposure regimen because of the absence of a treatment × regimen interaction. Panel (D) shows the concordance (least squares fit and linear correlation coefficient) between OP effects on stimulant responses (fluoride, forskolin, Mn2+, Mn2+/forskolin) for differentiating cells with 6 days of continuous OP exposure vs. 2 days of exposure + 4 days of recovery. Abbreviation: NS, not significant.

References

    1. Abreu-Villaça Y, Seidler FJ, Qiao D, Slotkin TA. Modeling the developmental neurotoxicity of nicotine in vitro: cell acquisition, growth and viability in PC12 cells. Dev. Brain Res. 2005;154:239–246. - PubMed
    1. Adigun AA, Seidler FJ, Slotkin TA. Disparate developmental neurotoxicants converge on the cyclic AMP signaling cascade, revealed by transcriptional profiles in vitro and in vivo. Brain Res. 2010a in press. - PMC - PubMed
    1. Adigun AA, Wrench N, Seidler FJ, Slotkin TA. Neonatal organophosphorus pesticide exposure alters the developmental trajectory of cell signaling cascades controlling metabolism: differential effects of diazinon and parathion. Environ. Health Perspect. 2010b in press. - PMC - PubMed
    1. Auman JT, Seidler FJ, Slotkin TA. Neonatal chlorpyrifos exposure targets multiple proteins governing the hepatic adenylyl cyclase signaling cascade: implications for neurotoxicity. Dev. Brain Res. 2000;121:19–27. - PubMed
    1. Axelrad JC, Howard CV, McLean WG. The effects of acute pesticide exposure on neuroblastoma cells chronically exposed to diazinon. Toxicology. 2003;185:67–78. - PubMed

Publication types