

Trajectories of brain aging in middle-aged and older adults: regional and individual differences
- PMID: 20298790
- PMCID: PMC2879584
- DOI: 10.1016/j.neuroimage.2010.03.020
Trajectories of brain aging in middle-aged and older adults: regional and individual differences
Abstract
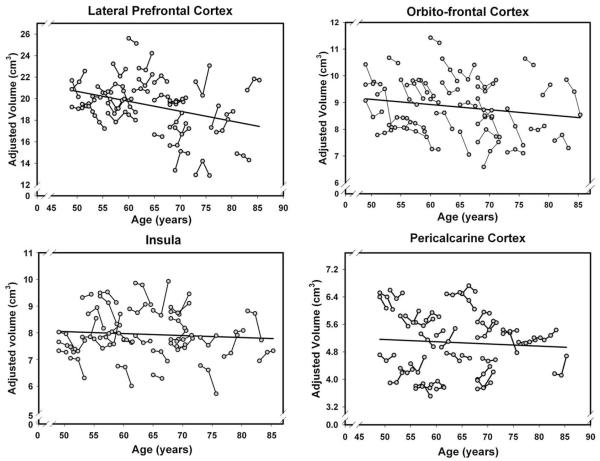
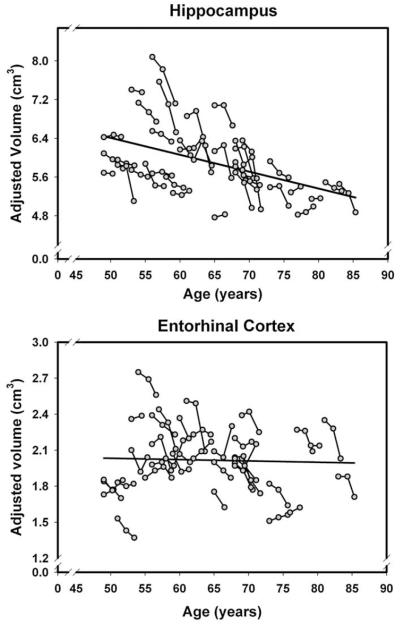
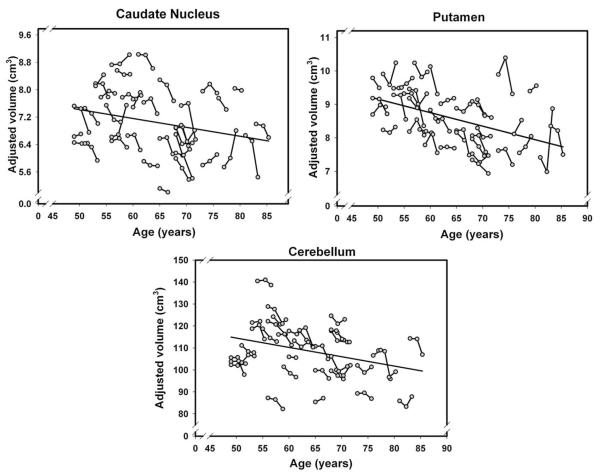
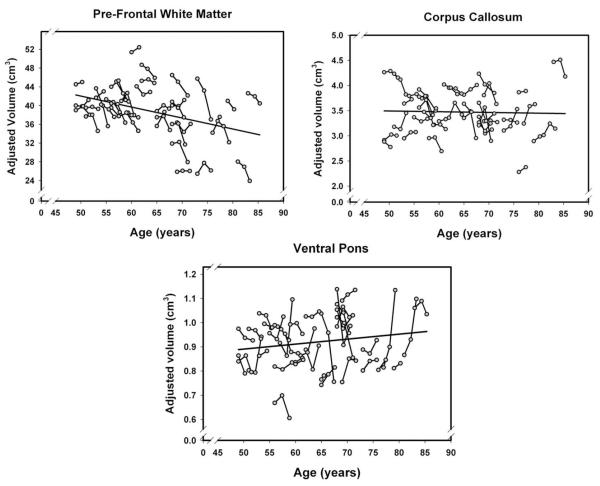
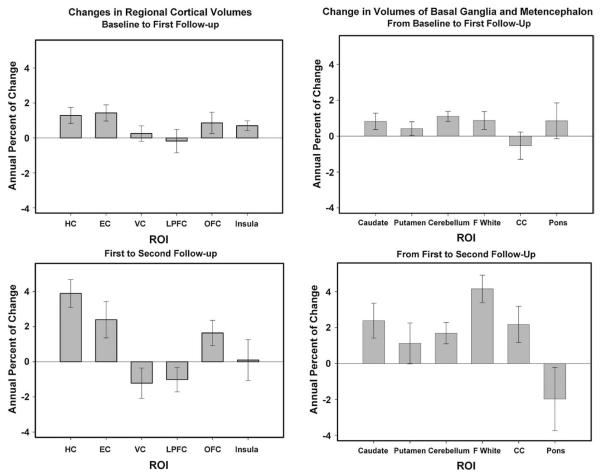
The human brain changes with age. However, the rate and the trajectories of change vary among the brain regions and among individuals, and the reasons for these differences are unclear. In a sample of healthy middle-aged and older adults, we examined mean volume change and individual differences in the rate of change in 12 regional brain volumes over approximately 30 months. In addition to the baseline assessment, there were two follow-ups, 15 months apart. We observed significant average shrinkage of the hippocampus, entorhinal cortex, orbital-frontal cortex, and cerebellum in each of the intervals. Shrinkage of the hippocampus accelerated with time, whereas shrinkage of the caudate nucleus, prefrontal subcortical white matter, and corpus callosum emerged only at the second follow-up. Throughout both assessment intervals, the mean volumes of the lateral prefrontal and primary visual cortices, putamen, and pons did not change. Significant individual differences in shrinkage rates were observed in the lateral prefrontal cortex, the cerebellum, and all the white matter regions throughout the study, whereas additional regions (medial-temporal structures, the insula, and the basal ganglia) showed significant individual variation in change during the second follow-up. No individual variability was noted in the change of orbital frontal and visual cortices. In two white matter regions, we were able to identify factors associated with individual differences in brain shrinkage. In corpus callosum, shrinkage rate was greater in persons with hypertension, and in the pons, women and carriers of the ApoEepsilon4 allele exhibited declines not noted in the whole sample.
Copyright 2010 Elsevier Inc. All rights reserved.
Figures
References
-
- Baltes PB, Reese HW, Nesselroade JR. Life-span Developmental Psychology: an Introduction to Research Methods. Lawrence Erlbaum Associates; Hillsdale, NJ: 1988. (reprint of 1977 ed.)
-
- Bartzokis G, Lu PH, Mintz J. Quantifying age-related myelin breakdown with MRI: novel therapeutic targets for preventing cognitive decline and Alzheimer’s disease. J Alzheimers Dis. 2004;6(6 Suppl):S53–S59. - PubMed
-
- Christensen H, Anstey KJ, Parslow RA, Maller J, Mackinnon A, Sachdev P. The brain reserve hypothesis, brain atrophy and aging. Gerontology. 2007;53:82–95. Electronic publication ahead of print 2006 Oct 20. - PubMed
-
- Coffey CE, Saxton JA, Ratcliff G, Bryan RN, Lucke JF. Relation of education to brain size in normal aging: implications for the reserve hypothesis. Neurology. 1999;53:189–196. - PubMed
Publication types
MeSH terms
Substances
Grants and funding
LinkOut - more resources
Full Text Sources
Medical
