. 2010 Jul;38(13):4263-73.
doi: 10.1093/nar/gkq171. Epub 2010 Mar 18.

Identification and characterization of the two isoforms of the vertebrate H2A.Z histone variant

Affiliations

Identification and characterization of the two isoforms of the vertebrate H2A.Z histone variant

Ryo Matsuda et al. Nucleic Acids Res. 2010 Jul.

Abstract

Histone variants play important roles in the epigenetic regulation of genome function. The histone variant H2A.Z is evolutionarily conserved from yeast to vertebrates, and it has been reported to have multiple effects upon gene expression and insulation, and chromosome segregation. Recently two genes encoding H2A.Z were identified in the vertebrate genome. However, it is not yet clear whether the proteins transcribed from these genes are functionally distinct. To address this issue, we knocked out each gene individually in chicken DT40 cells. We found that two distinct proteins, H2A.Z-1 and H2A.Z-2, were produced from these genes, and that these proteins could be separated on a long SDS-PAGE gel. The two isoforms were deposited to a similar extent by the SRCAP chromatin-remodeling complex, suggesting redundancy to their function. However, cells lacking either one of the two isoforms exhibited distinct alterations in cell growth and gene expression, suggesting that the two isoforms have differential effects upon nucleosome stability and chromatin structure. These findings provide insight into the molecular basis of the multiple functions of the H2A.Z gene products.


Figures

Figure 1.
Figure 1.
Expression of both of H2A.Z-1 and H2A.Z-2 genes in vertebrate cells. (A) Expression of H2A.Z-1 and H2A.Z-2 in HeLa, mouse embryonic fibroblast (MEF), and chicken DT40 cells was evaluated by RT-PCR using primer sets specific for the cDNAs of H2A.Z-1 and H2A.Z-2, respectively. The transcript encoding β-actin was monitored as a control. (B) Expression of H2A.Z-1 and H2A.Z-2 in HeLa cells was compared by real-time quantitative RT-PCR analysis. The relative levels of the amplified fragments corresponding to the transcripts encoding the H2A.Z isoforms were estimated by comparison to those derived from cloned cDNA fragments corresponding to each isoform. The relative expression of H2A.Z-2 to H2A.Z-1 was plotted. The error bars represent the mean ± standard deviation from three experiments. (C) Northern blot analysis of mRNAs encoding H2A.Z-1 and H2A.Z-2 from DT40 cells. Total RNA was electrophoresed through a formaldehyde gel and hybridized to a fragment corresponding to the coding region of H2A.Z-1 cDNA (left) or H2A.Z-2 cDNA (right). Fragments corresponding to mRNAs encoding H2A.Z-1 and H2A.Z-2 are indicated on the right. An asterisk indicates a nonspecific band, which was confirmed by using H2A.Z-2 knockout cells.
Figure 2.
Figure 2.
Electrophoretic separation and identification of chicken H2A.Z-1 and H2A.Z-2 proteins. (A) The nuclear histone fractions from chicken (DT40 and embryonic fibroblast; CEF), human (HeLa and Nalm6), and mouse (MEF) cells were prepared by acid extraction. Histones were electrophoresed through a 28.5 cm 15% acrylamide gel for 5 h at 25 mA. A gel piece containing the histones was subjected to western blot analysis and H2A.Z isoforms were detected using an anti-H2A.Z antibody. The positions of the H2A and H4 histones are indicated at the left. (B) Histones from WT, H2A.Z-1 deficient and H2A.Z-2 deficient cells were prepared, and H2A.Z-1, H2A.Z-2 and H3 histones were detected as in (A). The relative intensities of the signals corresponding to H2A.Z-1 or H2A.Z-2 to that of the H3 histone are shown with the relative signal in WT cells defined as 1.0. The mean ± standard deviation from at least three independent experiments is shown. (C) Bacterially expressed and purified H2A.Z isoforms (recombinant H2A.Z-1 and H2A.Z-2) were electrophoresed as in (A) and detected by Coomassie staining (left panel). Western blot analysis was used to compare the mobility of the recombinant H2A.Z isoforms to that of the endogenous proteins in the chromatin fraction prepared from DT40 cells (right panel).
Figure 3.
Figure 3.
Impairment of the deposition of H2A.Z-1 and H2A.Z-2 in SRCAP complex-deficient cells. (A) The soluble chromatin fraction was prepared from tet-inducible Arp6-deficient cells before or after tet treatment (96 or 120 h). The deposition of H2A.Z isoforms was detected by western blot analysis following electrophoresis through a long-gel (upper panel). H3 histone was detected as a control in each fraction (Lower panel). The position of H2A.Z-1 and H2A.Z-2 are indicated at the left. (B) The signals corresponding to H2A.Z-1 and H2A.Z-2 were quantified and normalized to that of H3 histone. The relative deposition of the H2A.Z isoforms in each fraction is compared to that observed for H2A.Z-1 prior to induction of Arp6-deficiency in the graph. The error bars represent the mean ± standard deviation from at least three independent experiments.
Figure 4.
Figure 4.
Occupancy of H2A.Z-1 and H2A.Z-2 at various developmental stages of the chicken embryo. (A) The histone fraction was prepared from stage 20 to 32 (3–7-days) chicken embryo. The histones were subjected to western blot analysis using anti-H2A.Z (upper panel) and anti-H3 (lower panel) antibodies. The stage of the embryo is indicated above the panels as the number of stage of embryogenesis. (B) Quantification of the occupancy of H2A.Z isoforms in chicken embryos. The sum of the deposition of H2A.Z-1 and H2A.Z-2 was calculated, and is indicated with the occupancy at stage 20 defined as 1.0. (C) The occupancy of H2A.Z-1 relative to that of H2A.Z-2 is shown, with the ratio at stage 20 defined as 1.0. The error bars represent the mean ± standard deviation from at least three independent experiments.
Figure 5.
Figure 5.
Comparison of DT40 cells deficient in each of H2A.Z isoforms. (A) Comparison of the growth of WT, H2A.Z-1- and H2A.Z-2-deficient cells. Trypan blue staining was used to discern dead and living cells and the latter were counted. Doubling times were estimated from the growth curves. (B) Cell cycle distribution of WT, H2A.Z-1- and H2A.Z-2-deficient cells. Cells were stained with the FITC-anti-BrdU conjugate (y-axis, log scale) to quantify BrdU incorporation (BrdU duration: 20 min) and with 7-AAD to quantify total DNA content (x-axis, linear scale). In each panel, the lower left box, the upper box and the lower right box represent regions containing G1, S and G2/M phase cells, respectively. The region on the far lower left of each graph shows apoptotic cells. The numbers given in the boxes indicate the mean percentages of each gated event. (C) The mean percentages of gated events containing G1, S and G2 cells (upper panel) and containing apoptotic cells (lower panel) were compared between WT, H2A.Z-1- and H2A.Z-2-deficient cells. The increase of the apoptotic index in H2A.Z-2-deficient cells is statistically significant (P < 0.01). The error bars represent the mean ± standard deviation from at least three experiments.
Figure 6.
Figure 6.
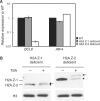
Different properties of the H2A.Z isoforms. (A) Decrease in the expression of the BCL6 gene in H2A.Z-2-deficient cells. Expression of BCL6 and IRF4 genes in WT, H2A.Z-1- and H2A.Z-2-deficient cells was compared by real-time quantitative RT-PCR analysis. The signals corresponding to the BCL6 and IRF4 mRNAs were normalized to that corresponding to the β-actin mRNA. The relative expression of these genes in H2A.Z-deficient cells compared to WT cells is plotted in log scale. The error bars represent the mean ± standard deviation from three experiments. (B) Mobility of the H2A.Z isoforms by long-gel SDS–PAGE after induction of histone hyperacetylation. H2A.Z-1- and H2A.Z-2-deficient cells were cultured in the presence of 500 nM tricostatin A (TSA) for 12 h. The chromatin fractions from control (TSA−) and TSA-treated (TSA+) cells were subjected to detection of H2A.Z-1 (right panel) and H2A.Z-2 (left panel) by long-gel SDS–PAGE. The positions of the H2A.Z isoforms in control cells (arrowhead) and the shift in the mobility of the polypeptides following induction of histone hyperacetylation (arrow) are shown.

Similar articles

Cited by

References

    1. Luger K, Rechsteiner TJ, Flaus AJ, Waye MM, Richmond TJ. Characterization of nucleosome core particles containing histone proteins made in bacteria. J. Mol. Biol. 1997;272:301–311. - PubMed
    1. Kornberg RD, Lorch Y. Twenty-five years of the nucleosome, fundamental particle of the eukaryote chromosome. Cell. 1999;98:285–294. - PubMed
    1. Altaf M, Auger A, Covic M, Côté J. Connection between histone H2A variants and chromatin remodeling complexes. Biochem. Cell Biol. 2009;87:35–50. - PubMed
    1. Santenard A, Torres-Padilla ME. Epigenetic reprogramming in mammalian reproduction: contribution from histone variants. Epigenetics. 2009;4:80–84. - PubMed
    1. Ren Q, Gorovsky MA. Histone H2A.Z acetylation modulates an essential charge patch. Mol. Cell. 2001;7:1329–1335. - PubMed

Publication types