

Ligand-specific conformation of extracellular loop-2 in the angiotensin II type 1 receptor
- PMID: 20299456
- PMCID: PMC2871501
- DOI: 10.1074/jbc.M109.094870
Ligand-specific conformation of extracellular loop-2 in the angiotensin II type 1 receptor
Abstract
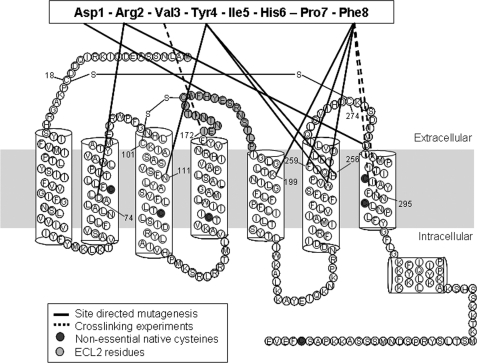
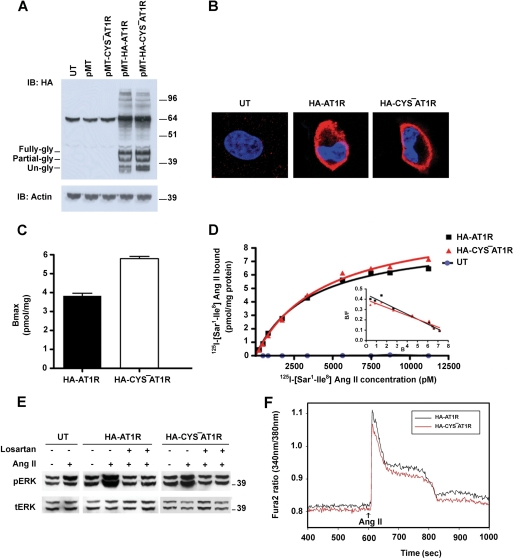
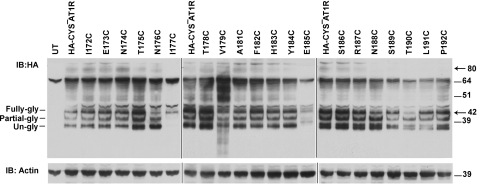
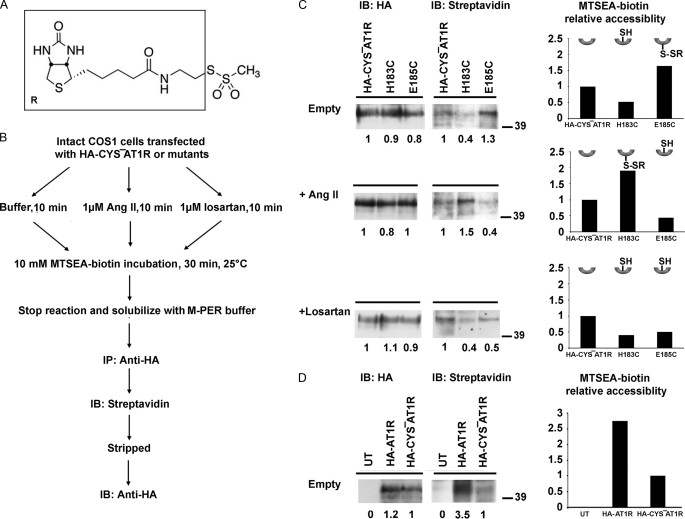
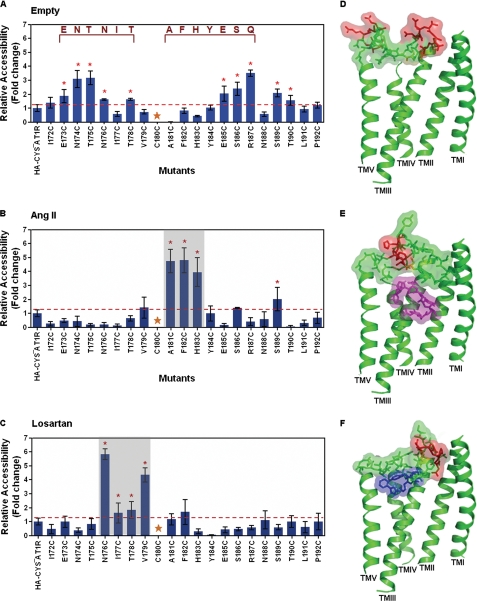
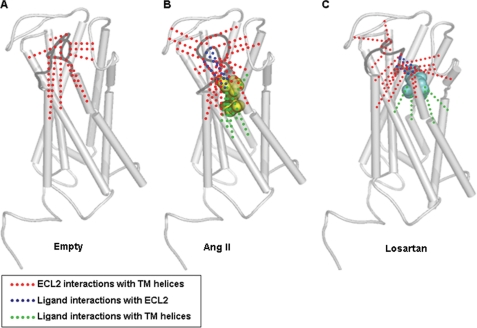
The orientation of the second extracellular loop (ECL2) is divergent in G-protein coupled receptor (GPCR) structures determined. This discovery provoked the question, is the ECL2 conformation differentially regulated in the GPCRs that respond to diffusible ligands? We have determined the conformation of the ECL2 of the angiotensin II type 1 receptor by reporter-cysteine accessibility mapping in different receptor states (i.e. empty, agonist-bound and antagonist-bound). We introduced cysteines at each position of ECL2 of an N-terminal epitope-tagged receptor surrogate lacking all non-essential cysteines and then measured reaction of these with a cysteine-reactive biotin probe. The ability of biotinylated mutant receptors to react with a steptavidin-HRP-conjugated antibody was used as the basis for examining differences in accessibility. Two segments of ECL2 were accessible in the empty receptor, indicating an open conformation of ECL2. These segments were inaccessible in the ligand-bound states of the receptor. Using the accessibility constraint, we performed molecular dynamics simulation to predict ECL2 conformation in different states of the receptor. Analysis suggested that a lid conformation similar to that of ECL2 in rhodopsin was induced upon binding both agonist and antagonist, but exposing different accessible segments delimited by the highly conserved disulfide bond. Our study reveals the ability of ECL2 to interact with diffusing ligands and to adopt a ligand-specific lid conformation, thus, slowing down dissociation of ligands when bound. Distinct conformations induced by the bound agonist and the antagonist around the conserved disulfide bond suggest an important role for this disulfide bond in producing different functional states of the receptor.
Figures
Similar articles
-
Long range effect of mutations on specific conformational changes in the extracellular loop 2 of angiotensin II type 1 receptor.J Biol Chem. 2013 Jan 4;288(1):540-51. doi: 10.1074/jbc.M112.392514. Epub 2012 Nov 8. J Biol Chem. 2013. PMID: 23139413 Free PMC article.
-
Structure of the human angiotensin II type 1 (AT1) receptor bound to angiotensin II from multiple chemoselective photoprobe contacts reveals a unique peptide binding mode.J Biol Chem. 2013 Mar 22;288(12):8187-8197. doi: 10.1074/jbc.M112.442053. Epub 2013 Feb 5. J Biol Chem. 2013. PMID: 23386604 Free PMC article.
-
Structure-Function Basis of Attenuated Inverse Agonism of Angiotensin II Type 1 Receptor Blockers for Active-State Angiotensin II Type 1 Receptor.Mol Pharmacol. 2015 Sep;88(3):488-501. doi: 10.1124/mol.115.099176. Epub 2015 Jun 29. Mol Pharmacol. 2015. PMID: 26121982 Free PMC article.
-
Structural determinants for binding, activation, and functional selectivity of the angiotensin AT1 receptor.J Mol Endocrinol. 2014 Oct;53(2):R71-92. doi: 10.1530/JME-14-0125. Epub 2014 Jul 10. J Mol Endocrinol. 2014. PMID: 25013233 Review.
-
Biased agonism of the angiotensin II type 1 receptor.Mini Rev Med Chem. 2012 Aug;12(9):812-6. doi: 10.2174/138955712800959134. Mini Rev Med Chem. 2012. PMID: 22681254 Review.
Cited by
-
Reassessment of the unique mode of binding between angiotensin II type 1 receptor and their blockers.PLoS One. 2013 Nov 8;8(11):e79914. doi: 10.1371/journal.pone.0079914. eCollection 2013. PLoS One. 2013. PMID: 24260317 Free PMC article.
-
The Presence of Anti-Angiotensin II Type-1 Receptor Antibodies Adversely Affect Kidney Graft Outcomes.Int J Environ Res Public Health. 2017 May 9;14(5):500. doi: 10.3390/ijerph14050500. Int J Environ Res Public Health. 2017. PMID: 28486415 Free PMC article.
-
Inactive conformation enhances binding function in physiological conditions.Proc Natl Acad Sci U S A. 2015 Aug 11;112(32):9884-9. doi: 10.1073/pnas.1503160112. Epub 2015 Jul 27. Proc Natl Acad Sci U S A. 2015. PMID: 26216967 Free PMC article.
-
BDflex: a method for efficient treatment of molecular flexibility in calculating protein-ligand binding rate constants from brownian dynamics simulations.J Chem Phys. 2012 Oct 7;137(13):135105. doi: 10.1063/1.4756913. J Chem Phys. 2012. PMID: 23039617 Free PMC article.
-
Identification of the GPR55 antagonist binding site using a novel set of high-potency GPR55 selective ligands.Biochemistry. 2013 Dec 31;52(52):9456-69. doi: 10.1021/bi4008885. Epub 2013 Dec 17. Biochemistry. 2013. PMID: 24274581 Free PMC article.
References
-
- Ji T. H., Grossmann M., Ji I. (1998) J. Biol. Chem. 273, 17299–17302 - PubMed
-
- Lagerström M. C., Schiöth H. B. (2008) Nat. Rev. Drug Discov. 7, 339–357 - PubMed
-
- Karnik S. S., Gogonea C., Patil S., Saad Y., Takezako T. (2003) Trends Endocrinol. Metab. 14, 431–437 - PubMed
-
- Bourne H. R., Meng E. C. (2000) Science 289, 733–734 - PubMed
Publication types
MeSH terms
Substances
Grants and funding
LinkOut - more resources
Full Text Sources
Molecular Biology Databases
