. 2010 May 7;285(19):14152-9.
doi: 10.1074/jbc.M110.115220. Epub 2010 Mar 18.

The RNA polymerase-associated factor 1 complex (Paf1C) directly increases the elongation rate of RNA polymerase I and is required for efficient regulation of rRNA synthesis

Affiliations

The RNA polymerase-associated factor 1 complex (Paf1C) directly increases the elongation rate of RNA polymerase I and is required for efficient regulation of rRNA synthesis

Yinfeng Zhang et al. J Biol Chem. .

Abstract

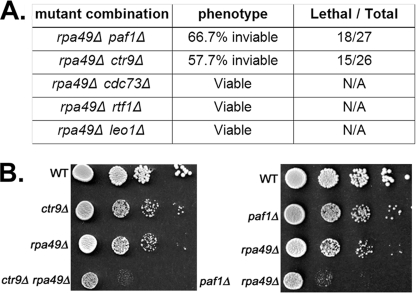
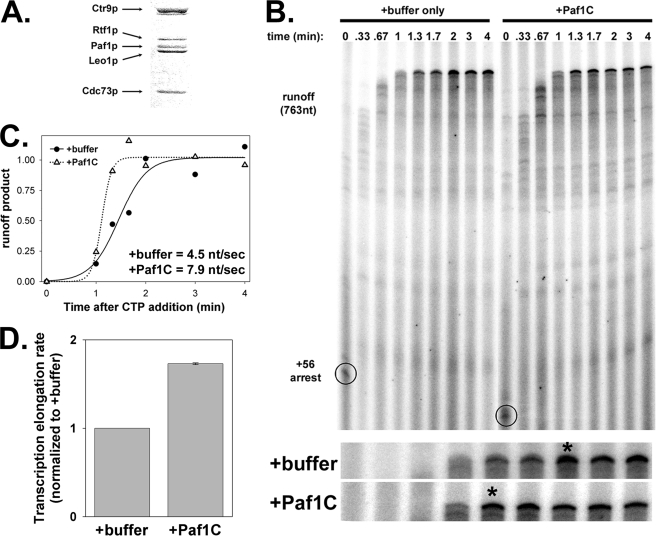
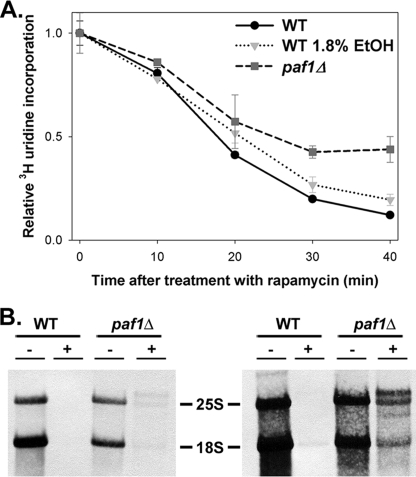
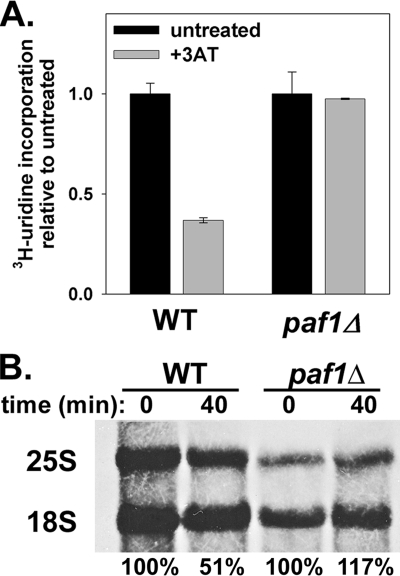
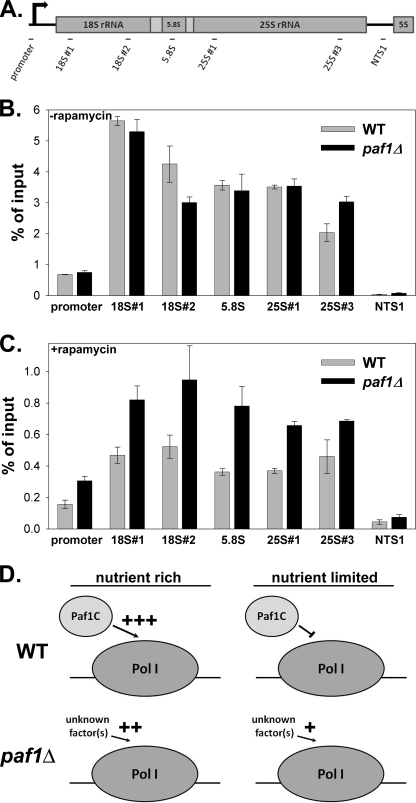
The rate of ribosome synthesis is proportional to the rate of cell proliferation; thus, transcription of rRNA by RNA polymerase I (Pol I) is an important target for the regulation of this process. Most previous investigations into mechanisms that regulate the rate of ribosome synthesis have focused on the initiation step of transcription by Pol I; however, recent studies in yeast and mammals have identified factors that influence transcription elongation by Pol I. The RNA polymerase-associated factor 1 complex (Paf1C) is a transcription elongation factor with known roles in Pol II transcription. We previously identified a role for Paf1C in transcription elongation by Pol I. In this study, genetic interactions between genes for Paf1C and Pol I subunits confirm this conclusion. In vitro studies demonstrate that purified Paf1C directly increases the rate of transcription elongation by Pol I. Finally, we show that Paf1C function is required for efficient control of Pol I transcription in response to target of rapamycin (TOR) signaling or amino acid limitation. These studies demonstrate that Paf1C plays an important direct role in cellular control of rRNA expression.


Figures

FIGURE 1.
FIGURE 1.
rpa49Δ paf1Δ and rpa49Δ ctr9Δ strains exhibit severe growth and survival defects. A, shown are genetic interactions between rpa49Δ and deletion of genes for all five Paf1C subunits. B, segregants were grown in SD complete medium overnight and diluted to A600 = 0.1, and then 10-fold serial dilutions were spotted on SD complete plates. After 2 days of incubation at 30°C, colonies were photographed.
FIGURE 2.
FIGURE 2.
Paf1C directly affects Pol I transcription in vitro. A, Paf1C was purified using His7-(HA)3-Paf1p. The Coomassie Blue-stained gel shows the positions of the five Paf1C subunits. Subunit identification was assigned based on molecular mass (the His7-(HA)3 tag adds 5.5 kDa to Paf1p) and confirmed by mass spectrometry. B, transcription elongation assays were performed in the presence of Paf1C or a buffer-only control. The positions of complexes synchronized (−CTP) at position +56 and the 763-nucleotide (nt) runoff product are indicated. Below the gel, an expanded view of runoff product accumulation is provided, with first point of maximum accumulation denoted with an asterisk. C, runoff product accumulation was quantified by phosphorimaging analysis and plotted versus time. Data were fit to sigmoidal curves. Elongation rates were estimated from the plots. D, activation of the Pol I elongation rate, normalized to the +buffer control, was averaged between three independent transcription elongation assays. Error bars represent ±1 S.D.
FIGURE 3.
FIGURE 3.
Pol I transcription in paf1Δ cells is resistant to rapamycin treatment. A, relative RNA synthesis rates were measured using [3H]uridine incorporation ± rapamycin (0.2 μg/ml) in WT (NOY396) and paf1Δ (DAS516) strains. Both strains, carrying the pRS316 plasmid, were grown in SD−Ura medium to A600 ≈ 0.3. After labeling with [3H]uridine, cultures were treated with 10% trichloroacetic acid and unlabeled uridine. Samples were then filtered using nitrocellulose, washed, dried, and counted in a scintillation counter. To control for the effect of slow growth on rapamycin sensitivity, a WT strain grown in S-ethanol−Ura was included. Data were averaged from duplicate samples from two independent cultures with error (S.D.) shown. B, RNA was purified from cells pulse-labeled with [3H]methylmethionine ± treatment with rapamycin (0.2 μg/ml, 40 min). Total RNA was run on a 1% formaldehyde-agarose gel, transferred to a membrane, and visualized by autoradiography. Both 1-day and 1-week exposures of the same blot are shown with the positions of major rRNA species indicated.
FIGURE 4.
FIGURE 4.
Pol I transcription in paf1Δ cells is resistant to 3-AT treatment. A, relative RNA synthesis rates were measured using [3H]uridine incorporation ± 3-AT (10 mm, 40 min) in WT (NOY396) and paf1Δ (DAS516) strains. Strains were made His+ and Ura+ by transformation with pRS313 and pRS316, respectively. Both strains were grown in SD−His−Ura medium to A600 ≈ 0.3. Samples were processed and quantified as described for Fig. 3. Data were averaged from duplicate samples from two independent cultures with error (S.D.) shown. B, RNA was purified from cells pulse-labeled with [3H]methylmethionine ± 3-AT (10 mm, 40 min). Total RNA was run on a 1% formaldehyde-agarose gel, transferred to a membrane, and visualized by autoradiography. 18 S and 25 S RNA bands were excised and counted in a scintillation counter. After correction for minimal background signal, 18 S and 25 S data were added together and expressed as a percentage of the untreated signal.
FIGURE 5.
FIGURE 5.
Paf1C function is required to reduce activity by Pol I in the presence of rapamycin. A, diagram of primer pairs used in real-time PCR analysis of ChIP data. B, Pol I occupancy over the rDNA as measured by ChIP. WT (NOY396) and paf1Δ (DAS516) cells were grown to mid-log phase in SD complete medium, harvested, and analyzed as described (7). Each bar represents the average of three 10-fold dilutions of immunoprecipitated DNA expressed as a percentage of total input DNA. Error bars represent ±1 S.D. C, Pol I occupancy of rDNA in WT (NOY396) and paf1Δ (DAS516) cells measured by ChIP after treatment with rapamycin (0.2 μg/ml, 40 min). Data were analyzed as described for B. D, model for the role of Paf1C in the activation and regulation of Pol I transcription.

Similar articles

Cited by

References

    1. Grummt I. (1999) Prog. Nucleic Acids Res. Mol. Biol. 62, 109–154 - PubMed
    1. Nomura M., Nogi Y., Oakes M. (2004) in The Nucleolus ( Olson M. O. J., ed) pp. 128–153, Landes Bioscience, Georgetown, TX
    1. Claypool J. A., French S. L., Johzuka K., Eliason K., Vu L., Dodd J. A., Beyer A. L., Nomura M. (2004) Mol. Biol. Cell 15, 946–956 - PMC - PubMed
    1. Fath S., Milkereit P., Peyroche G., Riva M., Carles C., Tschochner H. (2001) Proc. Natl. Acad. Sci. U.S.A. 98, 14334–14339 - PMC - PubMed
    1. Grummt I. (2003) Genes Dev. 17, 1691–1702 - PubMed

Publication types

MeSH terms