. 2010 May 21;285(21):16315-29.
doi: 10.1074/jbc.M109.092015. Epub 2010 Mar 18.

A combined computational and functional approach identifies new residues involved in pH-dependent gating of ASIC1a

Affiliations

A combined computational and functional approach identifies new residues involved in pH-dependent gating of ASIC1a

Luz Angélica Liechti et al. J Biol Chem. .

Abstract

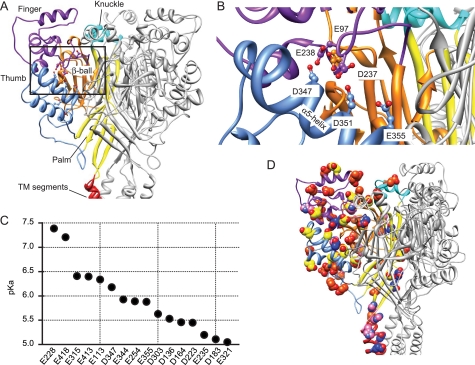
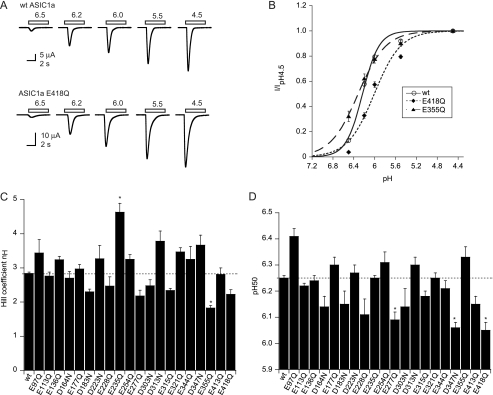
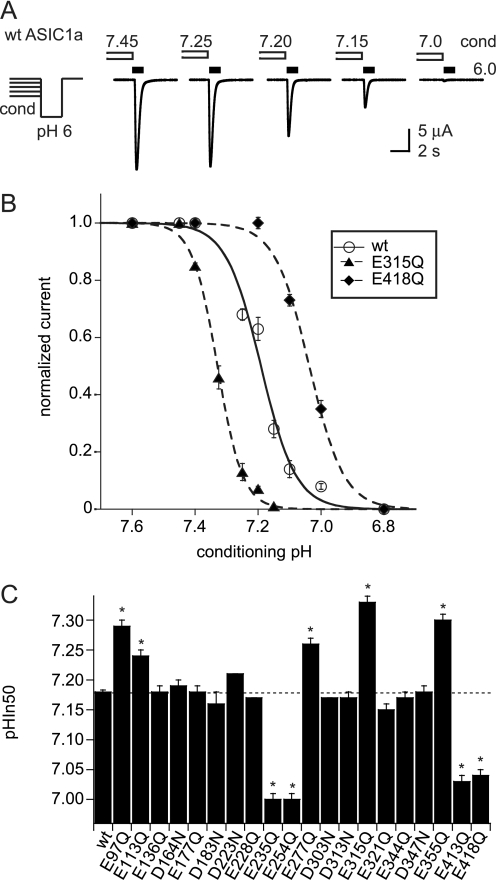
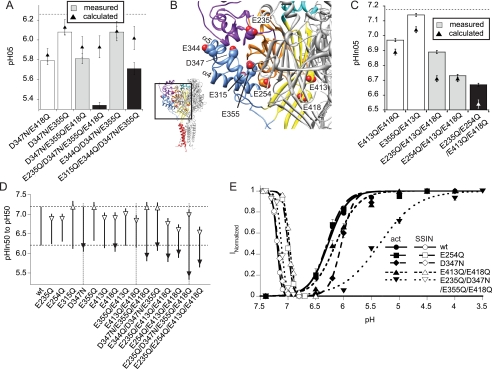
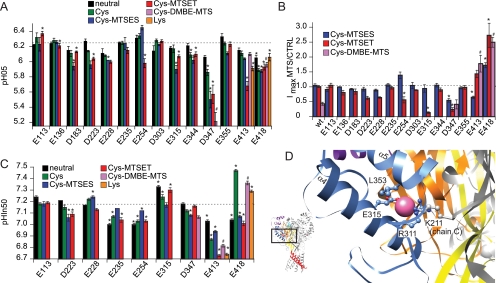
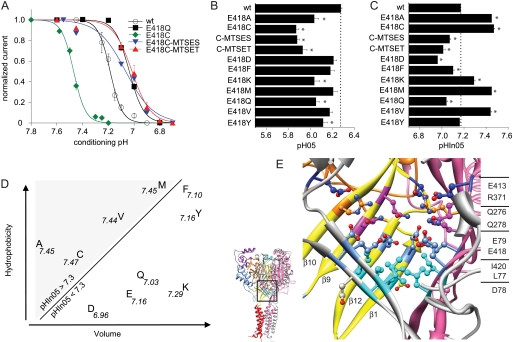
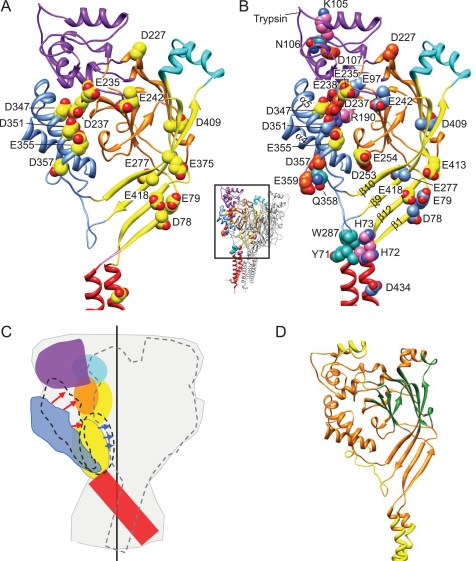
Acid-sensing ion channels (ASICs) are key receptors for extracellular protons. These neuronal nonvoltage-gated Na(+) channels are involved in learning, the expression of fear, neurodegeneration after ischemia, and pain sensation. We have applied a systematic approach to identify potential pH sensors in ASIC1a and to elucidate the mechanisms by which pH variations govern ASIC gating. We first calculated the pK(a) value of all extracellular His, Glu, and Asp residues using a Poisson-Boltzmann continuum approach, based on the ASIC three-dimensional structure, to identify candidate pH-sensing residues. The role of these residues was then assessed by site-directed mutagenesis and chemical modification, combined with functional analysis. The localization of putative pH-sensing residues suggests that pH changes control ASIC gating by protonation/deprotonation of many residues per subunit in different channel domains. Analysis of the function of residues in the palm domain close to the central vertical axis of the channel allowed for prediction of conformational changes of this region during gating. Our study provides a basis for the intrinsic ASIC pH dependence and describes an approach that can also be applied to the investigation of the mechanisms of the pH dependence of other proteins.


Figures

FIGURE 1.
FIGURE 1.
Calculation of pKa values in ASIC1a. A, extracellular part of human ASIC1a. One ASIC1a subunit is shown in color, identifying different parts of ASIC subunits (red, transmembrane segments; yellow, palm; orange, β-ball; blue, thumb; purple, finger; turquoise, knuckle) (25). B, view of the network of acidic residues on the finger loop originating in β-ball strands β6 and β7 and the thumb helix α5. The residue Glu-97 is more distant from the α5 helix than Asp-237 and Glu-238. The calculated pKa values for these residues are as follows: Glu-97, Glu-238, Asp-351 > 8, Asp-347 = 6.2, Glu-355 = 5.8, and Asp-237 < 5. C, pKa values for residues with pKa values between pH 8 and 5, calculated as described in the text. D, Glu, Asp, and His residues in the extracellular part of the human ASIC1a model; Asp and Glu, blue, pKa > 8; yellow, pKa < 8 and > 5; dark orange, pKa < 5; His (all pKa < 5), pink. These residues are shown on one of the three subunits, which is colored as in A.
FIGURE 2.
FIGURE 2.
pH dependence of activation of neutralization mutants. A, representative current traces of oocytes expressing ASIC1a WT or E418Q obtained by 5-s acidification to the pH values indicated, at a holding potential of −60 mV. B, pH dependence of activation of WT ASIC1a (○) and the mutants E418Q (♦) and E355Q (▴), n = 4–12. Currents are normalized to the peak current induced by the most acidic pH, pH4.5. The lines represent fits to the Hill equation (see “Experimental Procedures”). C, Hill coefficient was obtained from fits to the Hill equation. D, pH value for half-maximal activation, pH50 obtained from fits to the Hill equation, n ≥ 5. *, different from WT, p < 0.05. Averaged data are represented as mean ± S.E.
FIGURE 3.
FIGURE 3.
pH dependence of SSIN. ASIC currents were induced by 5-s acidification to pH 6 (for some mutants to pH 5.5) after exposure for 55 s to the conditioning pH. Control studies confirmed that the pH50 of WT ASIC1a does not depend on the activation pH (pHIn50 obtained with stimulation pH 6.0, 7.22 ± 0.02, and with stimulation pH 6.0, 7.22 ± 0.01, n = 8 each, direct comparison). A, protocol used and representative current traces with ASIC1a WT; conditioning pH indicated above open bars, pH-6 stimulation indicated by filled bars. B, plot of pH 6-induced currents as a function of the conditioning pH, of ASIC1a WT (○), the mutants E418Q (♦), and E315Q (▴). Currents are normalized to the response with the most alkaline conditioning pH used. The lines are fits to the Hill equation (see “Experimental Procedures”). C, pH for half-maximal inactivation (pHIn50) of neutralization mutants, n ≥ 8. *, different from WT, p < 0.05. Averaged data are represented as mean ± S.E.
FIGURE 4.
FIGURE 4.
pH dependence of channels containing several neutralization mutations. A, combinations of mutations affecting activation. pH50 values of mutants containing several neutralization mutations as indicated (double mutants, open bars; triple mutants, gray bars, quadruple mutants, black bars) and theoretical pH50 calculated as the sum of the individual differences in pH50 to WT (▴). For comparison, the WT pH50 is indicated by an interrupted horizontal line. B, illustration of the position of different mutations that were used in the combined mutants. C, combinations of mutations affecting SSIN. pHIn50 values of mutants containing several neutralization mutations as indicated (double mutants, open bars; triple mutants, gray bars, quadruple mutants, black bars) and theoretical pHIn50 calculated as the sum of the individual differences in pHIn50 to WT (▴). For comparison, the WT pHIn50 is indicated by an interrupted horizontal line. D, difference between pHIn50 and pH50 of single or combined mutations (upper panel, filled circles) and pHIn50 and pH50 connected by a vertical line (lower panel). Filled and open arrowheads indicate the direction of significant shifts relative to WT of pH50 and pHIn50, respectively. E, combined activation and inactivation curves of ASIC1a WT and the mutants E254Q (small ΔpHIn50 − pH50), D347N (affects exclusively activation), E413Q/E418Q (small ΔpHIn50 − pH50), and E235Q/D347N/E355Q/E418Q (large ΔpHIn50 − pH50). Filled symbols indicate activation, and open symbols indicate SSIN; n ≥ 7. Averaged data are represented as means ± S.E.
FIGURE 5.
FIGURE 5.
Effect of engineered Cys modification on ASIC1a activation and SSIN. A, pH50 of mutants to Gln or Asn (black bars) or Cys (green bars) or Lys (orange, only with Glu-413 and Glu-418) and of Cys mutants modified by MTSES (blue), MTSET (red), or DMBE-MTS (purple). The WT unmodified pH50 value is shown as an interrupted horizontal line. The MTS reagents were applied for 5 min at 1 mm. ASIC1a WT pH50 was slightly shifted by MTSES from 6.22 ± 0.02 to 6.19 ± 0.02, by MTSET from 6.26 ± 0.02 to 6.22 ± 0.02 (n = 12), and was markedly shifted by the uncharged DMBE-MTS (from 6.23 ± 0.01 to 6.11 ± 0.02, n = 4). B, relative change of the pH 4.5-induced ASIC peak current by MTS reagent exposure. The ASIC1a WT peak current was not significantly affected by the MTSET or MTSES exposure (current ratio after/before MTSES = 1.06 ± 0.06, MTSET = 1.01 ± 0.04, n = 12) but was decreased by DMBE-MTS (0.43 ± 0.05, n = 4). C, pHIn50 values, bar colors as in A. The WT unmodified pHIn50 value is shown as an interrupted horizontal line. ASIC1a WT pHIn50 was not affected by MTS reagents (pHIn50 before MTSES = 7.14 ± 0.00 and after MTSES = 7.14 ± 0.01; before MTSET = 7.16 ± 0.01 and after MTSET = 7.16 ± 0.01, n = 4; pHIn50 before DMBE-MTS = 7.19 ± 0.01 and after DMBE-MTS = 7.21 ± 0.00, n = 4). *, different from unmodified WT (p < 0.05); #, different from DMBE-MTS-exposed WT (p < 0.05). Averaged data are represented as mean ± S.E. D, residues in the proximity of the chloride ion-binding site. Each of the three subunits contains one chloride ion-binding site, located between α helices 4 and 5. Shown is the one in subunit A. The different parts of subunit A are shown in blue (thumb), purple (finger), orange (β-ball), and yellow (palm). Subunits B and C are shown in gray. The chloride ion is shown in pink. Two positively charged residues are positioned close to the chloride ion, Arg-311 of chain A and Lys-211 of chain C. The two other residues in close proximity are Glu-315 and Leu-353, both on subunit A.
FIGURE 6.
FIGURE 6.
Function of Glu-418. A, SSIN curve for ASIC1a WT (open circles), the mutants E418Q (black) and E418C unmodified (green), after modification by MTSES (blue) and MTSET (red); n ≥ 3. B, pH for half-maximal activation (pH50) of Glu-418 mutants and MTSES-exposed (C-MTSES) and MTSET-exposed E418C (C-MTSET), n ≥ 6. The conditioning pH in these experiments was 7.7 for mutants with positively shifted pHIn50. C, pH for half-maximal inactivation (pHIn50) of Glu-418 mutants and MTSES-exposed (C-MTSES) and MTSET-exposed E418C (C-MTSET), n ≥ 7. *, different from WT, p < 0.05. Averaged data are represented as mean ± S.E. D, plot of hydrophobicity (39) of amino acid residues to which Glu-418 was mutated as a function of their van der Waals volume. pHIn50 values are indicated close to each residue. E, view of the area around Glu-418 in the hASIC1a model. Subunit A is shown in yellow (palm) and orange (β-ball), and subunit B in pink, and subunit C (β10 and β9 removed for visibility) in gray. Side chains of residues pointing toward the central axis are shown from bottom to top in turquoise (Leu-77 and Ile-420), cornflower blue (Glu-79 and Glu-418), pink (Gln-276 and Gln-278), orange (Arg-371), and dark blue (Glu-413).
FIGURE 7.
FIGURE 7.
Overview of residues important for ASIC gating and scheme of predicted conformational changes. A, Asp and Glu residues, that are potentially important for pH sensation in ASIC activation (based on pKa calculation and functional data from this and previous studies, as detailed in the text) are shown on an ASIC1a subunit. B, residues shown in functional studies to affect ASIC1a pH dependence (see text), shown on one ASIC1a subunit. His, Arg, and Lys, magenta; Asp and Glu, blue (pKa > 8), yellow (8 > pKa > 5), orange (pKa < 5); other residues, turquoise. This figure is also represented as a supplemental video. C, illustration of the predicted conformational changes induced by acidification. The contours of the channel are indicated in gray, and the vertical central axis is indicated by a black line. One subunit with its six subdomains is shown in color (red, transmembrane segments; yellow, palm; orange, β-ball; blue, thumb; purple, finger; turquoise, knuckle), and the contours of a second subunit are indicated by an interrupted gray line. During ASIC activation, the thumb moves toward the β-ball (indicated by red arrows), leading to opening and subsequent inactivation. Inactivation involves a movement of the palm domains toward the central vertical axis, as indicated by the blue arrows. D, regions in an hASIC1a subunit are colored depending on their b-factor in the 2QTS PDB file: yellow for high b-factor, orange for intermediate, and green for low b-factor.

References

    1. Krishtal O. (2003) Trends Neurosci. 26, 477–483 - PubMed
    1. Wemmie J. A., Price M. P., Welsh M. J. (2006) Trends Neurosci. 29, 578–586 - PubMed
    1. Kellenberger S., Schild L. (2002) Physiol. Rev. 82, 735–767 - PubMed
    1. Sutherland S. P., Benson C. J., Adelman J. P., McCleskey E. W. (2001) Proc. Natl. Acad. Sci. U.S.A. 98, 711–716 - PMC - PubMed
    1. Sluka K. A., Price M. P., Breese N. M., Stucky C. L., Wemmie J. A., Welsh M. J. (2003) Pain 106, 229–239 - PubMed

Publication types

LinkOut - more resources