

Mechanisms of insulin resistance after insulin-induced hypoglycemia in humans: the role of lipolysis
- PMID: 20299466
- PMCID: PMC2874695
- DOI: 10.2337/db09-0745
Mechanisms of insulin resistance after insulin-induced hypoglycemia in humans: the role of lipolysis
Abstract
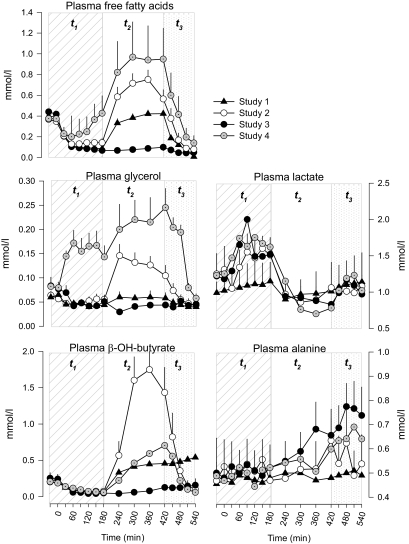
Objective: Changes in glucose metabolism occurring during counterregulation are, in part, mediated by increased plasma free fatty acids (FFAs), as a result of hypoglycemia-activated lipolysis. However, it is not known whether FFA plays a role in the development of posthypoglycemic insulin resistance as well.
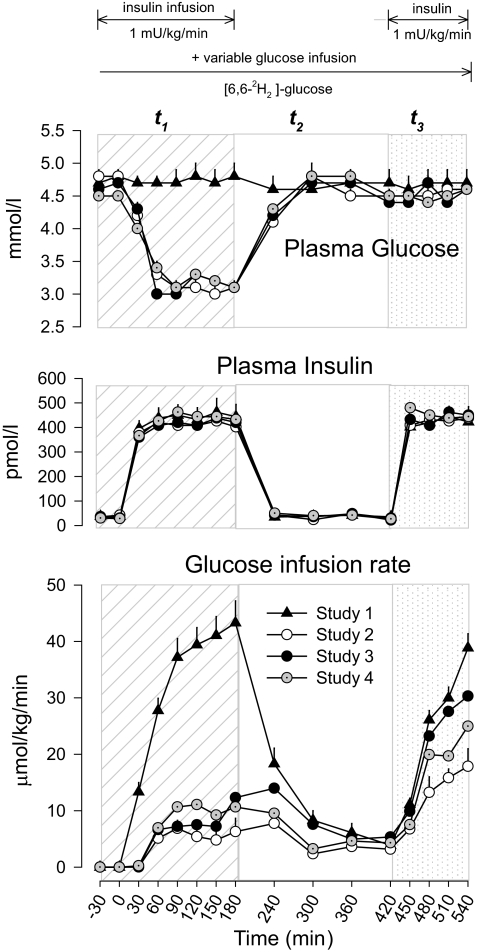
Research design and methods: We conducted a series of studies in eight healthy volunteers using acipimox, an inhibitor of lipolysis. Insulin action was measured during a 2-h hyperinsulinemic-euglycemic clamp (plasma glucose [PG] 5.1 mmo/l) from 5:00 p.m. to 7:00 p.m. or after a 3-h morning hyperinsulinemic-glucose clamp (from 10 a.m. to 1:00 p.m.), either euglycemic (study 1) or hypoglycemic (PG 3.2 mmol/l, studies 2-4), during which FFA levels were allowed to increase (study 2), were suppressed by acipimox (study 3), or were replaced by infusing lipids (study 4). [6,6-(2)H(2)]-Glucose was infused to measure glucose fluxes.
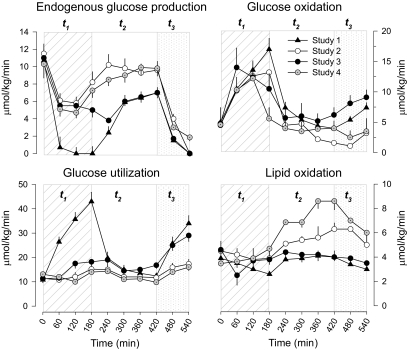
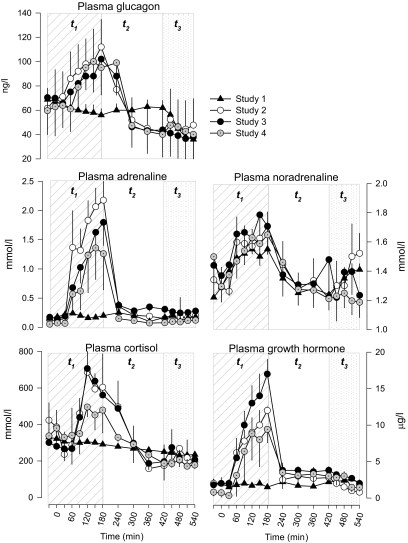
Results: Plasma adrenaline, norepinephrine, growth hormone, and cortisol levels were unchanged (P > 0.2). Glucose infusion rates (GIRs) during the euglycemic clamp were reduced by morning hypoglycemia in study 2 versus study 1 (16.8 +/- 2.3 vs. 34.1 +/- 2.2 micromol/kg/min, respectively, P < 0.001). The effect was largely removed by blockade of lipolysis during hypoglycemia in study 3 (28.9 +/- 2.6 micromol/kg/min, P > 0.2 vs. study 1) and largely reproduced by replacement of FFA in study 4 (22.3 +/- 2.8 micromol/kg/min, P < 0.03 vs. study 1). Compared with study 2, blockade of lipolysis in study 3 decreased endogenous glucose production (2 +/- 0.3 vs. 0.85 +/- 0.1 micromol/kg/min, P < 0.05) and increased glucose utilization (16.9 +/- 1.85 vs. 28.5 +/- 2.7 micromol/kg/min, P < 0.05). In study 4, GIR fell by approximately 23% (22.3 +/- 2.8 micromol/kg/min, vs. study 3, P = 0.058), indicating a role of acipimox per se on insulin action.
Conclusion: Lipolysis induced by hypoglycemia counterregulation largely mediates posthypoglycemic insulin resistance in healthy subjects, with an estimated overall contribution of approximately 39%.
Figures
References
-
- Mitrakou A, Ryan C, Veneman T, Mokan M, Jenssen T, Kiss I, Durrant J, Cryer P, Gerich J: Hierarchy of glycemic thresholds for counterregulatory hormone secretion, symptoms, and cerebral dysfunction. Am J Physiol 1991; 260: E67–E74 - PubMed
-
- Fanelli C, Pampanelli S, Epifano L, Rambotti AM, Ciofetta M, Modarelli F, Di Vincenzo A, Annibale B, Lepore M, Lalli C: Relative roles of insulin and hypoglycaemia on induction of neuroendocrine responses to, symptoms of, and deterioration of cognitive function in hypoglycaemia in male and female humans. Diabetologia 1994; 37: 797–807 - PubMed
-
- Bolli GB, Fanelli CG: Physiology of glucose counterregulation to hypoglycemia. Endocrinol Metab Clin North Am 1999; 28: 467–493, v - PubMed
-
- Heller SR, Cryer PE: Reduced neuroendocrine and symptomatic responses to subsequent hypoglycemia after 1 episode of hypoglycemia in nondiabetic humans. Diabetes 1991; 40: 223–226 - PubMed
-
- Somogyi M: Effect of insulin hypoglycemia on alimentary hyperglycemia. J Biol Chem 1951; 193: 859–871 - PubMed
MeSH terms
Substances
LinkOut - more resources
Full Text Sources
Medical
