

Chronic rapamycin treatment causes glucose intolerance and hyperlipidemia by upregulating hepatic gluconeogenesis and impairing lipid deposition in adipose tissue
- PMID: 20299475
- PMCID: PMC2874694
- DOI: 10.2337/db09-1324
Chronic rapamycin treatment causes glucose intolerance and hyperlipidemia by upregulating hepatic gluconeogenesis and impairing lipid deposition in adipose tissue
Abstract
Objective: The mammalian target of rapamycin (mTOR)/p70 S6 kinase 1 (S6K1) pathway is a critical signaling component in the development of obesity-linked insulin resistance and operates a nutrient-sensing negative feedback loop toward the phosphatidylinositol 3-kinase (PI 3-kinase)/Akt pathway. Whereas acute treatment of insulin target cells with the mTOR complex 1 (mTORC1) inhibitor rapamycin prevents nutrient-induced insulin resistance, the chronic effect of rapamycin on insulin sensitivity and glucose metabolism in vivo remains elusive.
Research design and methods: To assess the metabolic effects of chronic inhibition of the mTORC1/S6K1 pathway, rats were treated with rapamycin (2 mg/kg/day) or vehicle for 15 days before metabolic phenotyping.
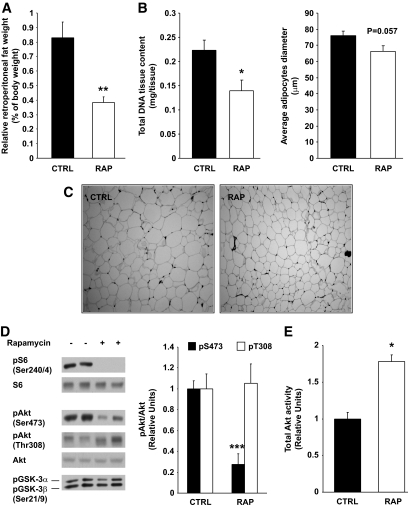
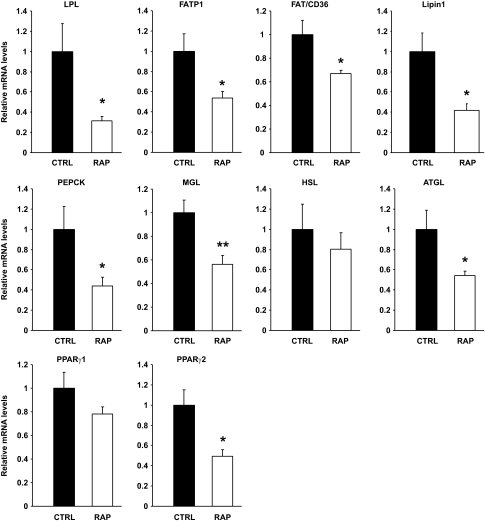
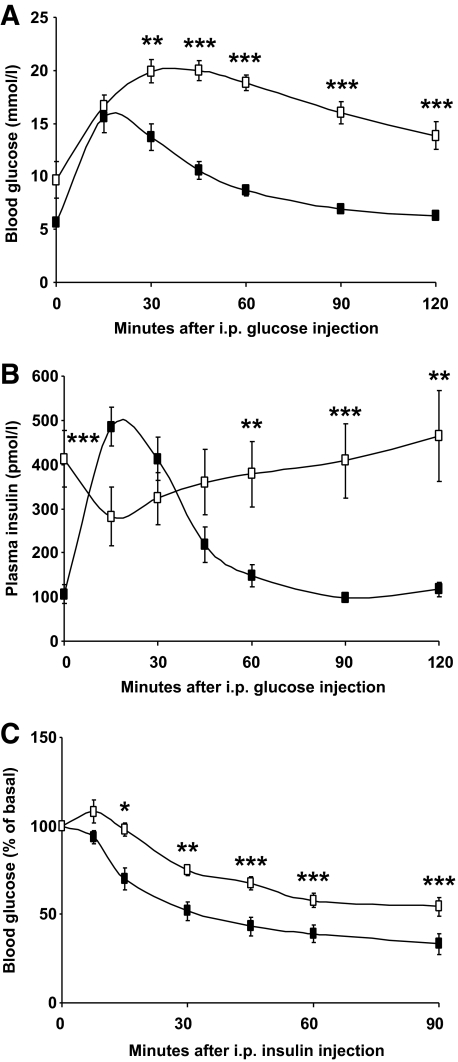
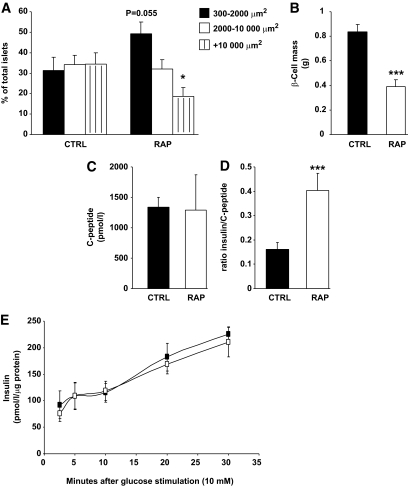
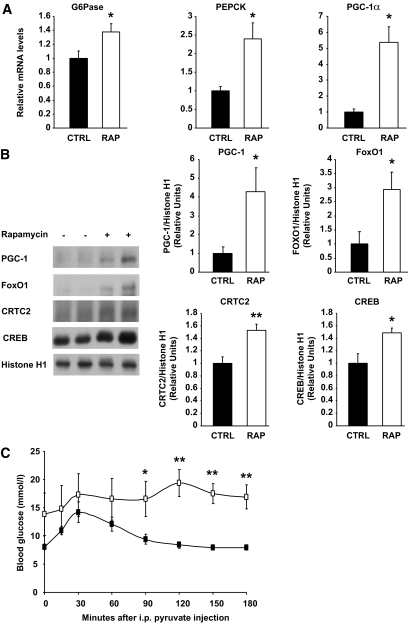
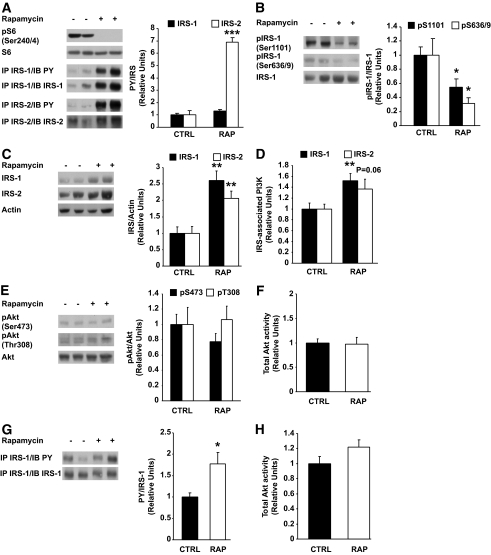
Results: Chronic rapamycin treatment reduced adiposity and fat cell number, which was associated with a coordinated downregulation of genes involved in both lipid uptake and output. Rapamycin treatment also promoted insulin resistance, severe glucose intolerance, and increased gluconeogenesis. The latter was associated with elevated expression of hepatic gluconeogenic master genes, PEPCK and G6Pase, and increased expression of the transcriptional coactivator peroxisome proliferator-activated receptor-gamma coactivator-1alpha (PGC-1alpha) as well as enhanced nuclear recruitment of FoxO1, CRTC2, and CREB. These changes were observed despite normal activation of the insulin receptor substrate/PI 3-kinase/Akt axis in liver of rapamycin-treated rats, as expected from the blockade of the mTORC1/S6K1 negative feedback loop.
Conclusions: These findings unravel a novel mechanism by which mTORC1/S6K1 controls gluconeogenesis through modulation of several key transcriptional factors. The robust induction of the gluconeogenic program in liver of rapamycin-treated rats underlies the development of severe glucose intolerance even in the face of preserved hepatic insulin signaling to Akt and despite a modest reduction in adiposity.
Figures
Similar articles
-
Chronic inhibition of the mTORC1/S6K1 pathway increases insulin-induced PI3K activity but inhibits Akt2 and glucose transport stimulation in 3T3-L1 adipocytes.Mol Endocrinol. 2010 Apr;24(4):766-78. doi: 10.1210/me.2009-0328. Epub 2010 Mar 4. Mol Endocrinol. 2010. PMID: 20203102 Free PMC article.
-
Pharmacological inhibition of S6K1 increases glucose metabolism and Akt signalling in vitro and in diet-induced obese mice.Diabetologia. 2016 Mar;59(3):592-603. doi: 10.1007/s00125-015-3839-6. Epub 2016 Jan 5. Diabetologia. 2016. PMID: 26733005
-
PPARγ activation attenuates glucose intolerance induced by mTOR inhibition with rapamycin in rats.Am J Physiol Endocrinol Metab. 2014 May 1;306(9):E1046-54. doi: 10.1152/ajpendo.00683.2013. Epub 2014 Mar 11. Am J Physiol Endocrinol Metab. 2014. PMID: 24619883
-
Adrenoceptors promote glucose uptake into adipocytes and muscle by an insulin-independent signaling pathway involving mechanistic target of rapamycin complex 2.Pharmacol Res. 2017 Feb;116:87-92. doi: 10.1016/j.phrs.2016.12.022. Epub 2016 Dec 23. Pharmacol Res. 2017. PMID: 28025104 Review.
-
Rationale and hurdles of inhibitors of hepatic gluconeogenesis in treatment of diabetes mellitus.Diabetes Res Clin Pract. 1995 Aug;28 Suppl:S195-200. doi: 10.1016/0168-8227(95)01079-s. Diabetes Res Clin Pract. 1995. PMID: 8529514 Review.
Cited by
-
Combined application of rapamycin and atorvastatin improves lipid metabolism in apolipoprotein E-deficient mice with chronic kidney disease.BMB Rep. 2021 Mar;54(3):170-175. doi: 10.5483/BMBRep.2021.54.3.136. BMB Rep. 2021. PMID: 33050984 Free PMC article.
-
Evidence for rapamycin toxicity in pancreatic β-cells and a review of the underlying molecular mechanisms.Diabetes. 2013 Aug;62(8):2674-82. doi: 10.2337/db13-0106. Diabetes. 2013. PMID: 23881200 Free PMC article. Review.
-
PPARγ-induced upregulation of subcutaneous fat adiponectin secretion, glyceroneogenesis and BCAA oxidation requires mTORC1 activity.Biochim Biophys Acta Mol Cell Biol Lipids. 2021 Aug;1866(8):158967. doi: 10.1016/j.bbalip.2021.158967. Epub 2021 May 15. Biochim Biophys Acta Mol Cell Biol Lipids. 2021. PMID: 34004356 Free PMC article.
-
Fasting and rapamycin: diabetes versus benevolent glucose intolerance.Cell Death Dis. 2019 Aug 13;10(8):607. doi: 10.1038/s41419-019-1822-8. Cell Death Dis. 2019. PMID: 31406105 Free PMC article. Review.
-
Sirolimus: Efficacy and Complications in Children With Hyperinsulinemic Hypoglycemia: A 5-Year Follow-Up Study.J Endocr Soc. 2019 Feb 7;3(4):699-713. doi: 10.1210/js.2018-00417. eCollection 2019 Apr 1. J Endocr Soc. 2019. PMID: 30882046 Free PMC article.
References
-
- Wullschleger S, Loewith R, Hall MN: TOR signaling in growth and metabolism. Cell 2006; 124: 471–484 - PubMed
-
- Tremblay F, Marette A: Amino acid and insulin signaling via the mTOR/p70 S6 kinase pathway: a negative feedback mechanism leading to insulin resistance in skeletal muscle cells. J Biol Chem 2001; 276: 38052–38060 - PubMed
-
- Khamzina L, Veilleux A, Bergeron S, Marette A: Increased activation of the mammalian target of rapamycin pathway in liver and skeletal muscle of obese rats: possible involvement in obesity-linked insulin resistance. Endocrinology 2005; 146: 1473–1481 - PubMed
-
- Tremblay F, Gagnon A, Veilleux A, Sorisky A, Marette A: Activation of the mammalian target of rapamycin pathway acutely inhibits insulin signaling to Akt and glucose transport in 3T3–L1 and human adipocytes. Endocrinology 2005; 146: 1328–1337 - PubMed
Publication types
MeSH terms
Substances
Grants and funding
LinkOut - more resources
Full Text Sources
Molecular Biology Databases
Research Materials
Miscellaneous
