. 2010 Jun;59(6):1424-34.
doi: 10.2337/db09-1212. Epub 2010 Mar 18.

Deletion of the alpha-arrestin protein Txnip in mice promotes adiposity and adipogenesis while preserving insulin sensitivity

Affiliations

Deletion of the alpha-arrestin protein Txnip in mice promotes adiposity and adipogenesis while preserving insulin sensitivity

William A Chutkow et al. Diabetes. 2010 Jun.

Abstract

Objective: Thioredoxin interacting protein (Txnip), a regulator of cellular oxidative stress, is induced by hyperglycemia and inhibits glucose uptake into fat and muscle, suggesting a role for Txnip in type 2 diabetes pathogenesis. Here, we tested the hypothesis that Txnip-null (knockout) mice are protected from insulin resistance induced by a high-fat diet.

Research design and methods: Txnip gene-deleted (knockout) mice and age-matched wild-type littermate control mice were maintained on a standard chow diet or subjected to 4 weeks of high-fat feeding. Mice were assessed for body composition, fat development, energy balance, and insulin responsiveness. Adipogenesis was measured from ex vivo fat preparations, and in mouse embryonic fibroblasts (MEFs) and 3T3-L1 preadipocytes after forced manipulation of Txnip expression.

Results: Txnip knockout mice gained significantly more adipose mass than controls due to a primary increase in both calorie consumption and adipogenesis. Despite increased fat mass, Txnip knockout mice were markedly more insulin sensitive than controls, and augmented glucose transport was identified in both adipose and skeletal muscle. RNA interference gene-silenced preadipocytes and Txnip(-/-) MEFs were markedly adipogenic, whereas Txnip overexpression impaired adipocyte differentiation. As increased adipogenesis and insulin sensitivity suggested aspects of augmented peroxisome proliferator-activated receptor-gamma (PPARgamma) response, we investigated Txnip's regulation of PPARgamma function; manipulation of Txnip expression directly regulated PPARgamma expression and activity.

Conclusions: Txnip deletion promotes adiposity in the face of high-fat caloric excess; however, loss of this alpha-arrestin protein simultaneously enhances insulin responsiveness in fat and skeletal muscle, revealing Txnip as a novel mediator of insulin resistance and a regulator of adipogenesis.


Figures

FIG. 1.
FIG. 1.
Adiposity, food consumption, metabolic rate, and physical activity in Txnip-null and wild-type control mice before and after high-fat feeding. A: Total mass, lean body mass, and total adipose weight for Txnip knockout and wild-type control mice assessed by 1H magnetic resonance spectroscopy and expressed as After HFD − Before HFD weights. n = 8 per group. B: Mean difference in weight between HFD and SCD excised fat depots. n = 6 per group. C–H: Metabolic activity measurements assessed by CLAMS. Values represent 72 h of monitoring, graphically represented with hourly values averaged to the same 24-h period. n = 8 per group: (C) Energy expenditure indexed to body mass in kilograms. D: Energy expenditure unadjusted for body mass. E, left: Energy expenditure plotted against total body mass with fitted lines of linear regression; (right) energy expenditure adjusted for body mass by ANCOVA. n = 8 per group. F, left: Average food consumption during a 60-h period plotted against total body mass with fitted lines of linear regression; (right) unadjusted comparison of mean food consumption. n = 8 per group. G: Respiratory quotient (RQ). H: Locomotor activity. *P < 0.05. **Not significant (NS) for the comparison of the mean difference between wild-type and Txnip knockout mice integrated during 72 h of monitoring. Epydid, epididymal; KO, knockout; SC, subcutaneous; WT, wild type.
FIG. 2.
FIG. 2.
Effects of insulin stimulation on glucose utilization during hyperinsulinemic-euglycemic clamp studies after 4 weeks of HFD feeding. A and B: Intraperitoneal insulin tolerance test (ITT), 0.25 mU insulin/g body wt. A: Absolute blood glucose levels. B: Relative blood glucose levels indexed to t = 0 levels in each group. n = 6–7 per group. *P < 0.05 between HFD-fed wild-type and Txnip knockout mice, **P < 0.05 between HFD-fed wild-type and SCD-fed wild-type mice. C: Basal glucose and glucose infusion rates (GIRs) for wild-type and Txnip knockout mice during euglycemic-hyperinsulinemic clamp studies. GIR was averaged over the final 60 min of the clamp (inset box), P < 0.0001. n = 7 per group. *P < 0.0001 for basal glucose levels prior to insulin infusion. D–H: Labeled glucose precursor whole-body glucose utilization studies. D: Whole-body glucose disposal. E: Basal hepatic glucose output. F: Whole-body glycolytic rate. G: Whole-body glycogen synthesis rates. Parameters were determined by 3H-glucose infusion throughout the euglycemic-hyperinsulinemic clamp protocol. n = 7 per group for each. H: 2DG uptake into skeletal muscle (quad) and WAT. 14C-2DG was infused during the final 55 min of the 140-min euglycemic-hyperinsulinemic clamp protocol, and individual tissues were excised for scintillation counting. n = 7 per group. AUC, area under the curve.
FIG. 3.
FIG. 3.
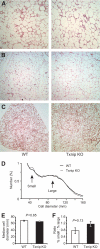
Txnip deletion does not alter adipose structure or cell size. A–C: Representative histologic sections from various adipose depots after HFD feeding: (A) visceral fat, (B) subcutaneous fat, and (C) brown fat. Each section is at ×10 magnification. D–F: Adipocyte sizing by multisizer analysis after high-fat feeding: (D) mean relative frequency distribution of epididymal adipocyte cell sizes; n = 6 per genotype. E: Median cell diameter of the large adipocyte population, derived from the Gaussian profile of large adipocyte cell size distribution. F: The fractional ratio of small to large adipocytes. White bars = wild type, black bars = Txnip knockout. (A high-quality digital color representation of this figure is available in the onlime issue.)
FIG. 4.
FIG. 4.
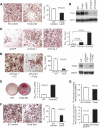
Txnip deletion promotes adipocyte differentiation. A, left: Representative Oil red O (ORO) staining of 3T3-L1 adipocytes after lentiviral overexpression of Txnip or control vectors and standard DMI induction; ×4 magnification. Right: Triglyceride content from alcohol-extracted ORO dye quantified at optical density 520 nm (OD520). n = 4 replicates. B: Representative Txnip protein expression and β-actin loading control levels in 3T3-L1 96 h after lentiviral transduction. C: 3T3-L1 adipocyte formation using ½ standard DMI induction after Txnip silencing by shRNA lentiviral transduction. n = 4 replicates for ORO extraction. D: 3T3-L1 stably transduced with shTxnip1 (shRNA targeting 3′ untranslated region) followed by Txnip cDNA or control vector lentivirus superinfection, then induced to differentiate with ½ standard DMI. Representative images; graph represents ORO extraction with n = 6 replicates. Txnip and β-actin loading control protein expression levels relative to unsilenced 3T3-L1 transduced with empty vector. The white line indicates removed lanes. E: Wild-type and Txnip knockout embryonic fibroblast (day 14.5, untransformed passage 4) at day 9 after adipocyte induction with standard DMI + 50 μmol/l rosiglitazone. n = 6 replicates for ORO extraction. F: Txnip knockout MEFs after Txnip or control vector expression by lentiviral transduction; n = 4 replicates for ORO extraction. G: Rate of 14C-pyruvate incorporation into de novo glycerol formation in differentiated 3T3-L1 adipocytes, 96 h after transduction with Txnip or Txnip shRNA lentivirus and indicated controls. n = 6 replicates. Graphs depict single representative experiments with error bars reflecting replicates; all experiments were repeated with similar results. MEF differentiation was confirmed using an independent untransformed wild-type and Txnip knockout line. Representative color images were nonlinearly color-contrast enhanced using equivalent settings and were not used for quantitative analysis. EV, empty vector; lenti, lentivirus; Rel, relative; undiff, undifferentiated. (A high-quality digial color representation of this figure is available in the online issue.)
FIG. 5.
FIG. 5.
Txnip deletion augments PPARγ-stimulated adipogenesis and PPARγ activity. A: Wild-type and Txnip knockout adipocyte differentiation at day 9 after DMI induction + increasing rosiglitazone concentrations. Total lipid levels are quantified after ORO extraction at OD520 staining. γ-antagonist = 1 μmol/l GW9229. *P < 0.001 for wild-type vs. Txnip knockout at each rosiglitazone concentration; n = 6 replicates per group. The representative color images were nonlinearly color-contrast enhanced using equivalent settings, and were not used for quantitative analysis. White bars = wild type, black bars = Txnip knockout. B: Endogenous PPARγ activation with increasing rosiglitazone dosing in 3T3-L1 cells stably transduced with Txnip or control lentivirus. PPARγ activity was determined by a transfected PPAR response element luciferase reporter stimulated by 18 h of rosiglitazone treatment (48 h after transfection). Transfection efficiency was normalized to β-galactosidase (β-gal) activity from a cotransfected β-gal reporter. n = 4 replicates per group. C and D: PPARγ LBD activation assay. PPARγ-LBD::GAL4 DNA-BD fusion protein was cotransfected with a GAL4 promoter-luciferase reporter into 3T3-L1 preadipocytes expressing Txnip lentivirus (C) or Txnip shRNA lentivirus (D) compared with relevant controls. Luciferase activity was determined after 18-h rosiglitazone stimulation. Transfection efficiency was normalized to β-gal activity from a cotransfected β-gal reporter. *P < 0.05, n = 4 replicates per condition. Graphs depict single representative experiments with error bars reflecting replicates. antag, antagonist. (A high-quality digital color representation of this figure is available in the online issue.)
FIG. 6.
FIG. 6.
High-fat feeding preferentially promotes PPARγ target gene expression in Txnip-null WAT. A: mRNA transcript expression of PPARγ target genes and PPARγ2 in WAT before and after high-fat feeding. n = 8–12 mice per group for each transcript. AP2, fatty acid binding protein 4; PC, pyruvate carboxylase; PEPCK, phosphoenolpyruvate carboxykinase; ACC-α, acetyl-CoA carboxylase-α; FAS, fatty acid synthase; LPL, lipoprotein lipase. B: Transcript expression levels for non-PPARγ target genes PCG1α and UCP2 after HFD. C and D: Adiponectin, leptin, and GLUT transcript expression levels in WAT after SCD vs. HFD. n = 8–12 mice per group.

Similar articles

Cited by

References

    1. Sethi JK, Vidal-Puig AJ: Thematic review series: adipocyte biology: adipose tissue function and plasticity orchestrate nutritional adaptation. J Lipid Res 2007; 48: 1253–1262 - PMC - PubMed
    1. Scherer PE: Adipose tissue: from lipid storage compartment to endocrine organ. Diabetes 2006; 55: 1537–1545 - PubMed
    1. Kim JK, Gavrilova O, Chen Y, Reitman ML, Shulman GI: Mechanism of insulin resistance in A-ZIP/F-1 fatless mice. J Biol Chem 2000; 275: 8456–8460 - PubMed
    1. Petersen KF, Oral EA, Dufour S, Befroy D, Ariyan C, Yu C, Cline GW, DePaoli AM, Taylor SI, Gorden P, Shulman GI: Leptin reverses insulin resistance and hepatic steatosis in patients with severe lipodystrophy. J Clin Invest 2002; 109: 1345–1350 - PMC - PubMed
    1. Semple RK, Chatterjee VK, O'Rahilly S: PPAR gamma and human metabolic disease. J Clin Invest 2006; 116: 581–589 - PMC - PubMed

Publication types

MeSH terms