. 2010 Apr 9;328(5975):235-9.
doi: 10.1126/science.1184655. Epub 2010 Mar 18.

Heritable individual-specific and allele-specific chromatin signatures in humans

Affiliations

Heritable individual-specific and allele-specific chromatin signatures in humans

Ryan McDaniell et al. Science. .

Abstract

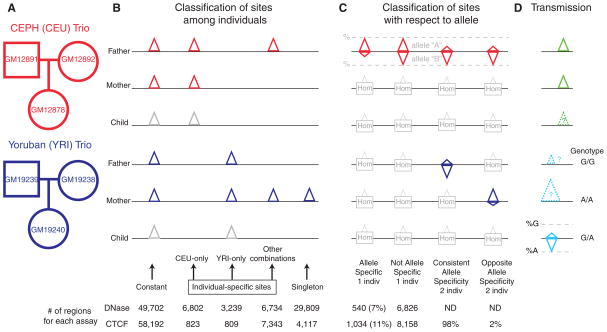
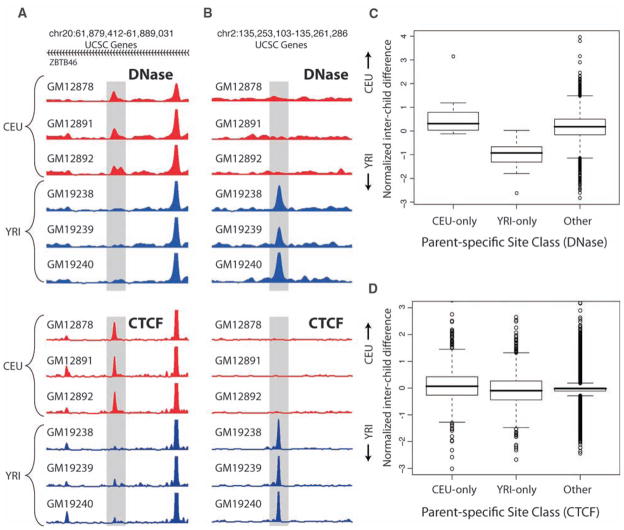
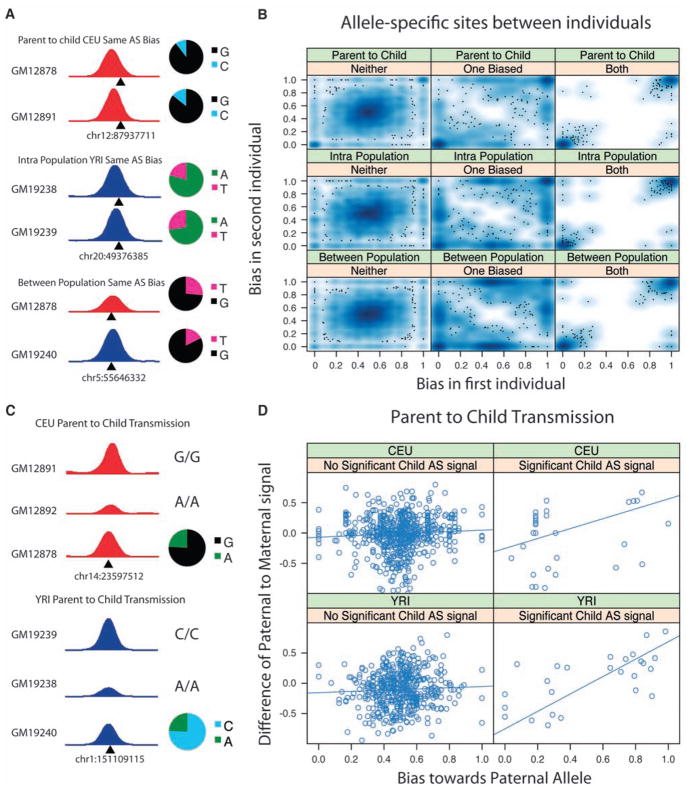
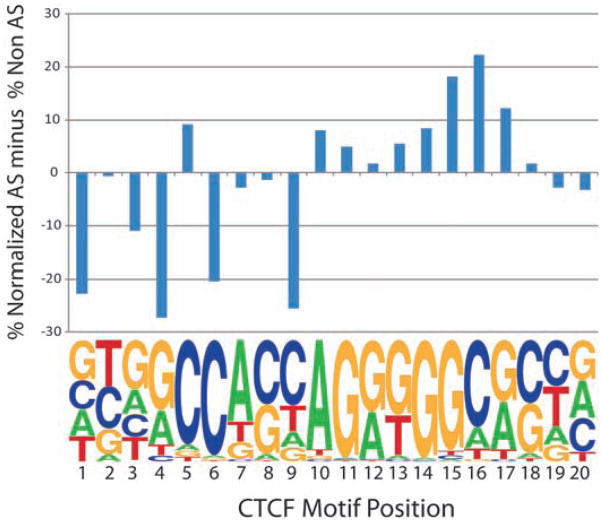
The extent to which variation in chromatin structure and transcription factor binding may influence gene expression, and thus underlie or contribute to variation in phenotype, is unknown. To address this question, we cataloged both individual-to-individual variation and differences between homologous chromosomes within the same individual (allele-specific variation) in chromatin structure and transcription factor binding in lymphoblastoid cells derived from individuals of geographically diverse ancestry. Ten percent of active chromatin sites were individual-specific; a similar proportion were allele-specific. Both individual-specific and allele-specific sites were commonly transmitted from parent to child, which suggests that they are heritable features of the human genome. Our study shows that heritable chromatin status and transcription factor binding differ as a result of genetic variation and may underlie phenotypic variation in humans.


Figures

Fig. 1
Fig. 1
(A) Cell lines from CEU and YRI parent-child trios. (B) Classification of DNase I HS or CTCF binding sites among individuals. Constant sites are those occurring in all four parents. CEU- and YRI-only sites occurred in both parents within only one population. Sites occurring in one individual (singletons) or in other combinations were also noted (table S2). Sites in children were not used in this initial classification (gray). (C) Sites that are allele-specific (skewed toward one allele) in one individual, not allele-specific in one individual, consistent allele-specific in two individuals, and opposite allele-specific in two individuals. Homozygous (Hom) individuals for an allele are not informative. (D) Transmission tests show that CEU- or YRI-only sites are more likely in children from the same population (green; see also Fig. 2), and allele-specific sites in children correspond to signal intensities in parents who are homozygous for different alleles (turquoise; see also Fig. 3). Numbers and percentages of all categories are indicated at the bottom. The orientation of the triangles indicates the two alleles that are assayed; triangle sizes indicate differences in signal strength (in terms of number of sequence reads).
Fig. 2
Fig. 2
Individual-specific chromatin transmission. (A) Example of CEU-only individual-specific DNase I HS and CTCF sites (shaded areas). (B) Example of YRI-only individual-specific sites. (C and D) Genome-wide individual-specific DNase I HS sites (C) and CTCF sites (D) were categorized as CEU-only, YRI-only, or other combinations. The standard box plots of the relative normalized interchild differences for these categories show that the child signal was significantly closer to the parental sites from its own population (P < 10−15 for DNase I HS, P < 10−8 for CTCF; Wilcoxon rank-sum test). Numbers at top of (A) and (B) are chromosome numbers followed by start-stop coordinates from the UCSC Genome Browser. In (A) the indicated sites occur in the ZBTB46 gene, whose direction of transcription is right to left (as indicated by arrowheads).
Fig. 3
Fig. 3
Comparison of allele-specific sites between individuals. (A) Each subpanel shows a different allele-specific site in two individuals in the indicated category. The overlapping SNP is indicated below. Adjoining pie charts show concordant allelic bias within the ChIP-seq reads for each site. (B) Allele-specific CTCF site correlations, as shown by smoothed scatterplots (13) of biases between any two individuals (parent-child, intrapopulation, and between-population) where the bias was significant in neither, one, or both individuals. Because of the large number of sites, the density of sites is shown by shades of blue, with outlying sites to this density shown as points. In each pairwise comparison, the bias was predominantly correlated (lower left and upper right of each plot). (C) Allele-specific CTCF sites in a child where both parents are homozygous, showing transmissibility. Peak heights indicate relative binding strength in the parents. The parent homozygous for the allele that was overrepresented in the child has a stronger signal than the other parent. (D) Heterozygous CTCF sites in children where both parents were homozygous. Child sites were classified as allele-specific (right) or not (left). CTCF signal differences between parents were compared to each of the children. Zero on x axis represents 100% maternal bias; 1 represents 100% paternal bias.
Fig. 4
Fig. 4
Representation of allele-specific and non–allele-specific SNPs across the CTCF binding motif (17). The y axis indicates the difference between the two as a percentage of normalized total SNPs. Higher bars indicate an increased representation of allele-specific SNPs relative to other positions, which tends to occur at conserved positions.

References

    1. Cheung VG, Spielman RS. Nat Rev Genet. 2009;10:595. - PMC - PubMed
    1. Morley M, et al. Nature. 2004;430:743. - PMC - PubMed
    1. Zhang K, et al. Nat Methods. 2009;6:613. - PMC - PubMed
    1. Hatchwell E, Greally JM. Trends Genet. 2007;23:588. - PubMed
    1. Montgomery SB, Dermitzakis ET. Hum Mol Genet. 2009;18:R211. - PubMed

Publication types

MeSH terms

Associated data