. 2010 Jun;298(6):G833-41.
doi: 10.1152/ajpgi.00030.2010. Epub 2010 Mar 18.

Decreased phospho-Akt signaling in a mouse model of total parenteral nutrition: a potential mechanism for the development of intestinal mucosal atrophy

Affiliations

Decreased phospho-Akt signaling in a mouse model of total parenteral nutrition: a potential mechanism for the development of intestinal mucosal atrophy

Yongjia Feng et al. Am J Physiol Gastrointest Liver Physiol. 2010 Jun.

Abstract

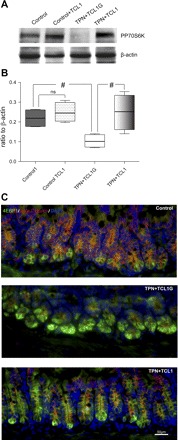
Total parenteral nutrition (TPN) leads to a decline in phosphatidylinositol 3-kinase (PI3K)/phospho-Akt (p-Akt) activity, affecting downstream signaling, reducing epithelial cell (EC) proliferation, and contributing to intestinal mucosal atrophy. We hypothesized that promoting Akt activity would prevent these changes. We used a novel Akt-activating peptide, TCL1 (a head-to-tail dimer of the Akt-binding domain of T-cell lymphoma-1), or an inactive mutant sequence TCL1G conjugated to a transactivator of transcription peptide sequence to promote intracellular uptake. Four groups of mice were studied, enteral nutrition group (control), control mice given a functioning TCL1 (control + TCL1), TPN mice given TCL1G (control peptide, TPN + TCL1G); and TPN mice given TCL1. TPN mice given TCL1G showed a significant decrease in jejunal EC p-Akt (Ser473 and Thr308) abundance, whereas TPN + TCL1 mice showed increased p-Akt (Ser473) abundance. Phosphorylation of beta-catenin and glycogen synthase kinase-3beta (downstream targets of Akt signaling) were also decreased in the TPN + TCL1G group and completely prevented in the TPN + TCL1 group. Use of TCL1 nearly completely prevented the decline in EC proliferation seen in the TPN + TCL1G group, as well as partly returned EC apoptosis levels close to controls. The mammalian target of rapamycin pathway demonstrated a similar reduction in activity in the TPN + TCL1G group that was significantly prevented in the TPN + TCL1 group. These results support a significant loss of PI3K/p-Akt signaling upon replacing enteral nutrition with TPN, and prevention of this loss demonstrates the key importance of PI3K/p-Akt signaling in maintaining gut integrity including EC proliferation and reduction in apoptosis.


Figures

Fig. 1.
Fig. 1.
Phosphorylated-Akt (p-AKT). A: shown are representative immunoblot bands for p-Akt (Ser473 and Thr308, respectively) and total Akt expression for the following groups: control, control given active peptide (TCL1, a head-to-tail dimer of the Akt-binding domain of T-cell lymphoma-1), total parenteral nutrition (TPN) plus nonactive peptide (TCL1G), and TPN plus TCL1. B: results are expressed as the mean fold change in p-Akt at Ser473 mRNA relative to total Akt. C: results are expressed as the mean fold change in p-Akt at Thr308 mRNA relative to total Akt. Note that p-Akt significantly decreased with TPN administration as shown in the TPN + TAT-TCL1G group. Administration of TAT-TCL1 to control mice did not affect p-Akt abundance; however, TAT-TCL1 in TPN mice partially prevented the decline in p-Akt (Ser473) (B). However, TAT-TCL1 did not affect p-Akt abundance at the Thr308 phosphorylation site (C). Results of each group represent an n = 4–6. #P < 0.05; **P < 0.001.
Fig. 2.
Fig. 2.
Abundance of phospho-glycogen synthase-kinase (p-GSK)-3β. p-GSK-3β was decreased with TPN, and this was prevented with TCL1 administration. A: representative immunoblot bands of p-GSK-3β and β-actin are shown for each study group. Note that p-GSK-3β is shown as the lower of the two bands, and p-GSK-3α is the upper band. B: summarized results of Western immunoblotting as expressed as the ratio of p-GSK-3β expression to β-actin. Note the decline in p-GSK-3β in the TPN + TCL1G group and a significant prevention of this decline in the TPN + TCL1 group. Results of each group represent an n = 4–6. *P < 0.01.
Fig. 3.
Fig. 3.
Intestinal epithelial cell β-catenin protein expression by Western immunoblots. A: representative gels for β-catenin. B: summarized results of β-catenin protein expression as normalized to β-actin. Intestinal epithelial cell β-catenin protein abundance was significantly decreased in the TPN + TCL1G group compared with controls. This decline was partially prevented in the TPN + TCL1 group. Results of each group represent an n = 5. **P < 0.001.
Fig. 4.
Fig. 4.
Cyclin D1 expression in intestinal epithelial cells. A: mRNA expression of cyclin D1. B: representative immunoblot gels for cyclin D1. C: summarized results of cyclin D1 protein expression. Cyclin D1 decreased significantly in the TPN + TCL1G group compared with controls. This decline was partially prevented in the TPN + TCL1 group. Results of each group represent an n = 5. **P < 0.001, *P < 0.01.
Fig. 5.
Fig. 5.
Intestinal epithelial cell proliferation. AE: proliferating cell nuclear antigen (PCNA) abundance. A, B, and C are representative immunofluorescent images of PCNA-positive crypt cells in control, TPN + TCL1G, and TPN + TCL1 groups. D and E are representative immunoblot gels and summaries of immunoblot data. F: intestinal epithelial cell proliferation. Proliferation is determined by 5-bromo-2-deoxyuridine (BrdU) crypt cell incorporation, as represented by a proliferation index (ratio of BrdU-positive cells to total number of crypt cells). Note that for PCNA and BrdU data, proliferation was significantly decreased in the TPN + TCL1G group compared with controls and that this decline was partially prevented in the TPN + TCL1 group. Results of each group represent an n = 5. **P < 0.001, *P < 0.01.
Fig. 6.
Fig. 6.
Alteration in mammalian target of rapamycin regulatory factors. A and B: representative immunoblot gels and summary of protein expression of phosphate P70S6K (PP70S6K) activity in study groups. Note the decline in PP70S6K in the TPN + TCL1G group and a partial prevention in the TPN + TCL1 group. Results of each group represent an n = 4–6. #P < 0.05. C: representative immunofluorescent images of 4E binding protein 1 (4EBP1) and β-catenin expression in control, TPN + TCL1G, and TPN + TCL1 groups. Note the marked increase in 4EBP1 (green fluorescence) in the TPN + TCL1G group and a return to lower levels of intensity in the TPN + TCL1 group. Also note the loss of β-catenin in the TPN + TCL1G group and a return to normal levels and cell membrane localization in the TPN + TCL1 group.
Fig. 7.
Fig. 7.
Alteration in intestinal epithelial cell apoptosis. AC: summarized results of Bad, Bax, and Bcl-2 mRNA abundance with real-time PCR in 3-day mucosal samples. Note the increase in Bad and Bax expression in the TPN + TCL1G group, and a partial prevention of these changes in the TPN + TCL1 group. No significant difference was noted in Bcl-2 expression in all groups. Results of each group represent the mean ± SD of n = 5–6, #P < 0.05; *P < 0.01; **P < 0.001. DG: active caspase-3 immunofluorescent staining. Note the marked increase in the number and density of caspase-3-positive staining cells in the TPN + TCL1G group (E) compared with the control group (D), with most of the positive staining epithelial cells located at the base of the villi. The TPN + TCL1 group was associated with a reduction in the number of caspase-3-positive cells (F). Summation of caspase-3 activity is expressed as the percentage of active caspase-3-positive epithelial cells (G).

Similar articles

Cited by

References

    1. Auguin D, Barthe P, Royer C, Stern M, Noguchi M, Arold S, Roumestand C. Structural basis for the co-activation of protein kinase B by T-cell Leukemia-1 (TCL1) family proto-oncoproteins. J Cell Biol 27: 35890–35902, 2004 - PubMed
    1. Beretta L, Gingras A, Svitkin Y, Hall M, Sonenberg N. Rapamycin blocks the phosphorylation of 4E-BP1 and inhibits cap-dependent initiation of translation. EMBO J 15: 658–664, 1996 - PMC - PubMed
    1. Blachier F, Boutry C, Bos C, Tomé D. Metabolism and functions of L-glutamate in the epithelial cells of the small and large intestines. Am J Clin Nutr 90: 814S–821S, 2009 - PubMed
    1. Chiu T, Santiskulvong C, Rozengurt E. EGF receptor transactivation mediates ANG II-stimulated mitogenesis in intestinal epithelial cells through the PI3-kinase/Akt/mTOR/p70S6K1 signaling pathway. Am J Physiol Gastrointest Liver Physiol 288: G182–G194, 2005 - PubMed
    1. Clark J, Gan H, Samocha A, Fox A, Buchman T, Coopersmith C. Enterocyte-specific epidermal growth factor prevents barrier dysfunction and improves mortality in murine peritonitis. Am J Physiol Gastrointest Liver Physiol 297: G471–G479, 2009 - PMC - PubMed

Publication types

MeSH terms