. 2010 Jun;108(6):1595-604.
doi: 10.1152/japplphysiol.01231.2009. Epub 2010 Mar 18.

A phenomenological model that predicts forces generated when electrical stimulation is superimposed on submaximal volitional contractions

Affiliations

A phenomenological model that predicts forces generated when electrical stimulation is superimposed on submaximal volitional contractions

Ramu Perumal et al. J Appl Physiol (1985). 2010 Jun.

Abstract

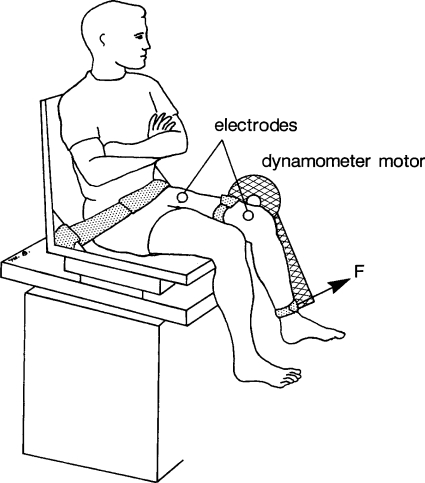
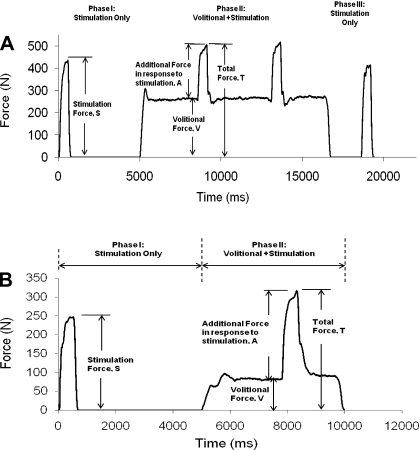
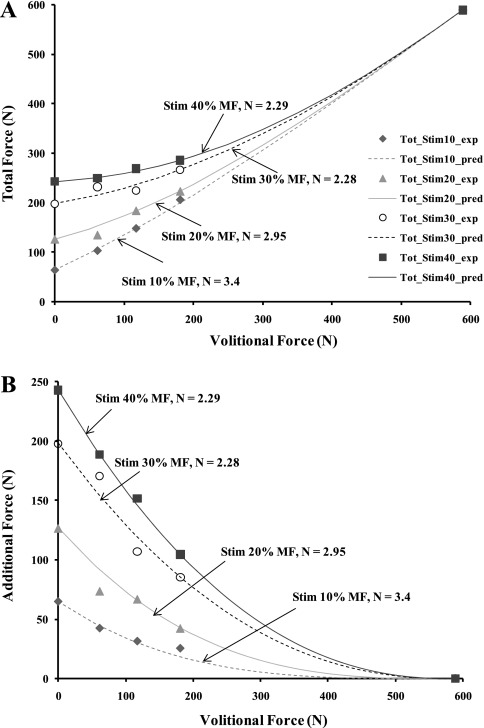
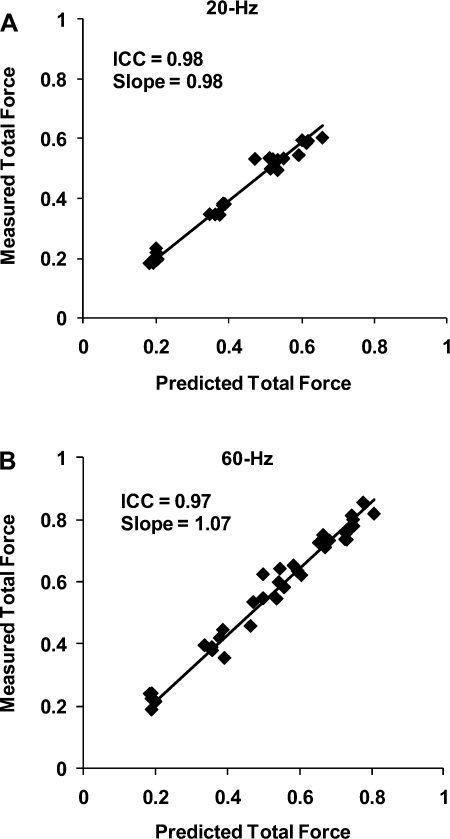
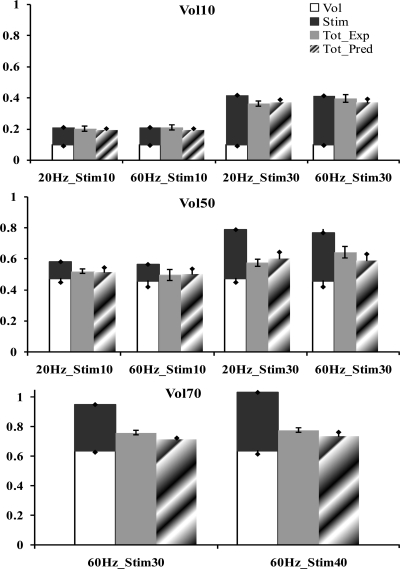
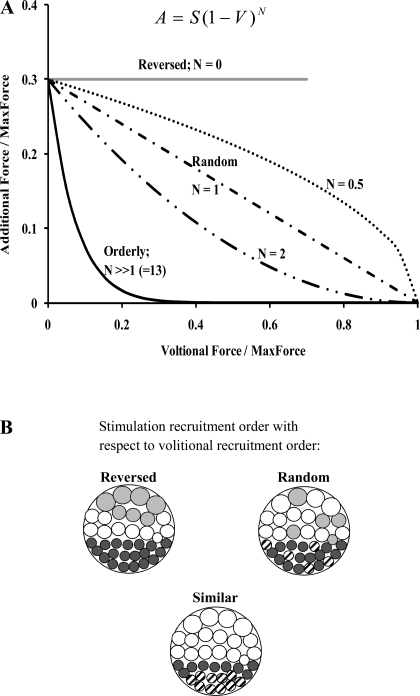
Superimposition of electrical stimulation during voluntary contractions is used to produce functional movements in individuals with central nervous system impairment, to evaluate the ability to activate a muscle, to characterize the nature of fatigue, and to improve muscle strength during postsurgical rehabilitation. Currently, the manner in which voluntary contractions and electrically elicited forces summate is not well understood. The objective of the present study is to develop a model that predicts the forces obtained when electrical stimulation is superimposed on a volitional contraction. Quadriceps femoris muscles of 12 able-bodied subjects were tested. Our results showed that the total force produced when electrical stimulation was superimposed during a volitional contraction could be modeled by the equation T=V+S[(MaxForce-V)/MaxForce]N, where T is the total force produced, V is the force in response to volitional contraction alone, S is the force response to the electrical stimulation alone, MaxForce is the maximum force-generating ability of the muscle, and N is a parameter that we posit depends on the differences in the motor unit recruitment order and firing rates between volitional and electrically elicited contractions. In addition, our results showed that the model predicted accurately (intraclass correlation coefficient>or=0.97) the total force in response to a wide range of stimulation intensities and frequencies superimposed on a wide range of volitional contraction levels. Thus the model will be helpful to clinicians and scientists to predict the amount of stimulation needed to produce the targeted force levels in individuals with partial paralysis.


Figures

Fig. 1.
Fig. 1.
Schematic representation of the experimental setup (see text for details). F, force measured by the dynamometer's transducer.
Fig. 2.
Fig. 2.
A: the 3 phases of muscle activation for a typical subject tested during model development. In phase I, using the predetermined stimulation amplitude, subjects were stimulated with a 30-Hz, 500-ms train to reach the targeted maximum force-generating ability of the muscle (%MaxForce); subjects then relaxed for ∼4.5 s after the stimulation was delivered. In phase II, subjects were instructed to contract volitionally and maintain the targeted volitional %MaxForce level for ∼8 s; the 30-Hz stimulation train with a predetermined stimulation amplitude (same as phase I) was superimposed at ∼3 and ∼6 s during the volitional contraction. In phase III, after completing the volitional contraction, subjects rested for ∼2 s before the first train was repeated. B: the 2 phases of muscle activation for a typical subject tested during model validation. In phase I, using the predetermined stimulation amplitude and frequency, subjects were stimulated with a 500-ms train to reach the targeted %MaxForce level; subjects then relaxed for ∼4.5 s after the stimulation was delivered. In phase II, subjects were instructed to contract volitionally and maintain the targeted volitional %MaxForce level for ∼5 s; a single stimulation train (same as phase I) was superimposed at ∼3 s during the volitional contraction.
Fig. 3.
Fig. 3.
A: plots of total force (T) vs. volitional force as a function of the 4 stimulation levels. Symbols represent the measured total force, and the lines represent the modeled total force. Total force is the sum of the volitional force and the additional force in response to stimulation that is superimposed on the volitional force (i.e., Stim 10% MF represents a stimulation amplitude set to produce 10% of the MaxForce). B: plots of additional force vs. volitional force as a function of the 4 stimulation levels. Data in A and B are from a typical subject. MaxForce for this subject was 588 N.
Fig. 4.
Fig. 4.
Plots of measured vs. predicted total forces at the validation frequencies of 20 (A) and 60 Hz (B) for 6 subjects tested during the validation phase of study. The total forces were normalized with respect to each subject's MaxForce. Intraclass correlation coefficients (ICCs) for agreement between measured and predicted data and the slopes of the trend lines (with intercepts set at 0) are reported at top left of each plot.
Fig. 5.
Fig. 5.
Bar graphs show the comparison of the mean predicted, normalized total forces of the linear model and our nonlinear model with respect to the mean measured, normalized total forces for 6 subjects tested during the validation phase of the study at a volitional level of 10% of MaxForce (Vol10; A), 50% of MaxForce (Vol50; B), and 70% of MaxForce (Vol70; C). Each x-axis represents the characteristics of the stimulation train (i.e., 20Hz_Stim10 represents a stimulation train with a frequency of 20 Hz and a stimulation intensity that produces 10% of MaxForce). Errors bars on the measured total force data (Tot_Exp; shaded bars) define the 95% confidence interval, and error bars on the remaining bars represent the standard deviations. The predictions of the linear model are shown as stacked bars of the forces in response to stimulation only (solid bars) and volitional contraction only (open bars). Tot_Pred, mean predicted, normalized total force data of nonlinear model (hatched bars).
Fig. 6.
Fig. 6.
Schematic representation of the effect of various values of parameter N from Eq. 1 (A) on the additional force produced by the electrical stimulation onto the volitional contraction. The additional force, A, the stimulation force, S, and the volitional force, V, are normalized with respect to the MaxForce. The beach ball pattern shown in B represents the interaction of the activation in response to stimulation and volitional contraction. The volitional activation always follows the size principle and recruits progressively from small to large motor units, and volitionally activated motor units in A are represented by solid circles. For a reversed recruitment order of motor units by electrical stimulation with respect to volitional contractions, the motor units are recruited from large to small units and are shown as shaded circles. For a random recruitment order of motor units by electrical stimulation, the motor units shown as hatched circles represent those motor units already activated by volitional contraction and cannot be activated by electrical stimulation. For the case where the recruitment order of motor units by electrical stimulation is similar the volitional recruitment order, if the force produced by electrical stimulation is less than the volitional contraction, then no additional force is produced. Under these conditions, in the beach ball labeled “similar,” all the motor units recruited by electrical stimulation are shown as hatched circles.

Similar articles

Cited by

References

    1. Barnett S, Cooney K, Johnston R. Electrically elicited quadriceps femoris muscle torque as a function of various electrode placements. J Clin Electrophysiol 3: 5–8, 1991
    1. Binder-Macleod SA, Halden EE, Jungles KA. Effects of stimulation intensity on the physiological responses of human motor units. Med Sci Sports Exerc 27: 556–565, 1995 - PubMed
    1. Binder-Macleod SA, Lee SC, Baadte SA. Reduction of the fatigue-induced force decline in human skeletal muscle by optimized stimulation trains. Arch Phys Med Rehabil 78: 1129–1137, 1997 - PubMed
    1. Chae J. Neuromuscular electrical stimulation for motor relearning in hemiparesis. Phys Med Rehabil Clin N Am 14, Suppl 1: S93–S109, 2003 - PubMed
    1. de Kroon JR, van der Lee JH, IJzerman MJ, Lankhorst GJ. Therapeutic electrical stimulation to improve motor control and functional abilities of the upper extremity after stroke: a systematic review. Clin Rehabil 16: 350–360, 2002 - PubMed

Publication types

LinkOut - more resources