

Improving initial polyp candidate extraction for CT colonography
- PMID: 20299733
- PMCID: PMC2845997
- DOI: 10.1088/0031-9155/55/7/019
Improving initial polyp candidate extraction for CT colonography
Abstract
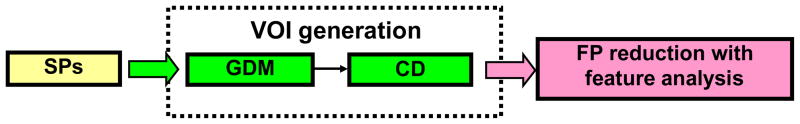
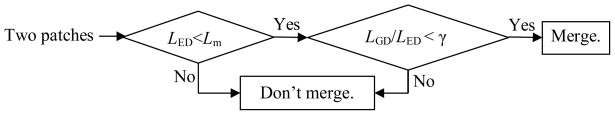
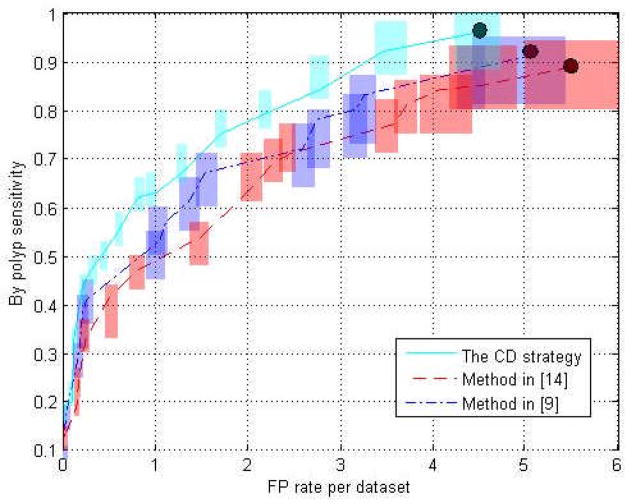
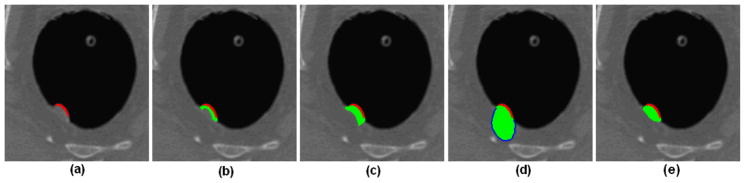
Reducing the number of false positives (FPs) as much as possible is a challenging task for computer-aided detection (CAD) of colonic polyps. As part of a typical CAD pipeline, an accurate and robust process for segmenting initial polyp candidates (IPCs) will significantly benefit the successive FP reduction procedures, such as feature-based classification of false and true positives (TPs). In this study, we introduce an improved scheme for segmenting IPCs. It consists of two main components. One is geodesic distance-based merging, which merges suspicious patches (SPs) for IPCs. Based on the merged SPs, another component, called convex dilation, grows each SP beyond the inner surface of the colon wall to form a volume of interest (VOI) for that IPC, so that the inner border of the VOI beyond the colon inner surface could be segmented as convex, as expected. The IPC segmentation strategy was evaluated using a database of 50 patient studies, which include 100 scans at supine and prone positions with 84 polyps and masses sized from 6 to 35 mm. The presented IPC segmentation strategy (or VOI extraction method) demonstrated improvements, in terms of having no undesirably merged true polyp and providing more helpful mean and variance of the image intensities rooted from the extracted VOI for classification of the TPs and FPs, over two other VOI extraction methods (i.e. the conventional method of Nappi and Yoshida (2003 Med. Phys. 30 1592-601) and our previous method (Zhu et al 2009 Cancer Manag. Res. 1 1-13). At a by-polyp sensitivity of 0.90, these three methods generated the FP rate (number of FPs per scan) of 4.78 (new method), 6.37 (Nappi) and 7.01 (Zhu) respectively.
Figures
Similar articles
-
Mixture of expert 3D massive-training ANNs for reduction of multiple types of false positives in CAD for detection of polyps in CT colonography.Med Phys. 2008 Feb;35(2):694-703. doi: 10.1118/1.2829870. Med Phys. 2008. PMID: 18383691
-
CT colonography: advanced computer-aided detection scheme utilizing MTANNs for detection of "missed" polyps in a multicenter clinical trial.Med Phys. 2010 Jan;37(1):12-21. doi: 10.1118/1.3263615. Med Phys. 2010. PMID: 20175461 Free PMC article.
-
Computerized detection of colorectal masses in CT colonography based on fuzzy merging and wall-thickening analysis.Med Phys. 2004 Apr;31(4):860-72. doi: 10.1118/1.1668591. Med Phys. 2004. PMID: 15125004 Clinical Trial.
-
Computer-aided detection for CT colonography: update 2007.Abdom Imaging. 2007 Sep-Oct;32(5):571-81. doi: 10.1007/s00261-007-9293-2. Abdom Imaging. 2007. PMID: 17690932 Review.
-
CAD: how it works, how to use it, performance.Eur J Radiol. 2013 Aug;82(8):1171-6. doi: 10.1016/j.ejrad.2012.04.022. Epub 2012 May 16. Eur J Radiol. 2013. PMID: 22595503 Review.
Cited by
-
Increasing computer-aided detection specificity by projection features for CT colonography.Med Phys. 2010 Apr;37(4):1468-81. doi: 10.1118/1.3302833. Med Phys. 2010. PMID: 20443468 Free PMC article.
-
Improved curvature estimation for computer-aided detection of colonic polyps in CT colonography.Acad Radiol. 2011 Aug;18(8):1024-34. doi: 10.1016/j.acra.2011.03.012. Epub 2011 Jun 11. Acad Radiol. 2011. PMID: 21652234 Free PMC article.
-
ROC operating point selection for classification of imbalanced data with application to computer-aided polyp detection in CT colonography.Int J Comput Assist Radiol Surg. 2014 Jan;9(1):79-89. doi: 10.1007/s11548-013-0913-8. Int J Comput Assist Radiol Surg. 2014. PMID: 23797823 Free PMC article.
-
Development of artificial intelligence technology in diagnosis, treatment, and prognosis of colorectal cancer.World J Gastrointest Oncol. 2022 Jan 15;14(1):124-152. doi: 10.4251/wjgo.v14.i1.124. World J Gastrointest Oncol. 2022. PMID: 35116107 Free PMC article. Review.
-
An adaptive paradigm for computer-aided detection of colonic polyps.Phys Med Biol. 2015 Sep 21;60(18):7207-28. doi: 10.1088/0031-9155/60/18/7207. Epub 2015 Sep 8. Phys Med Biol. 2015. PMID: 26348125 Free PMC article.
References
-
- American Cancer Society. Cancer Facts & Figures 2008. Atlanta: American Cancer Society; 2008.
-
- Eddy D. Screening for Colorectal Cancer. Annals of Internal Medicine. 1990;113:373–384. - PubMed
-
- Pickhardt P, Choi J, Hwang I, Butler J, Puckett M, Hildebrandt H, Wong R, Nugent P, Mysliwiec P, Schindler W. Computed tomographic virtual colonoscopy to screen for colorectal neoplasia in asymptomatic adults. New England Journal of Medicine. 2003;349(23):2191–2200. - PubMed
-
- Bielen D, Kiss G. Computer-aided detection for CT colonography: update 2007. Abdominal Imaging. 2007;32:571–581. - PubMed
Publication types
MeSH terms
Grants and funding
LinkOut - more resources
Full Text Sources
Other Literature Sources
Research Materials
Miscellaneous