. 2010 Apr 21;29(8):1401-11.
doi: 10.1038/emboj.2010.37. Epub 2010 Mar 18.

UTX mediates demethylation of H3K27me3 at muscle-specific genes during myogenesis

Affiliations

UTX mediates demethylation of H3K27me3 at muscle-specific genes during myogenesis

Shayesta Seenundun et al. EMBO J. .

Abstract

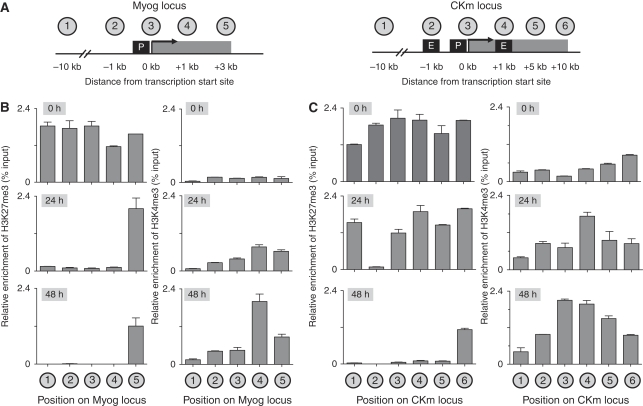
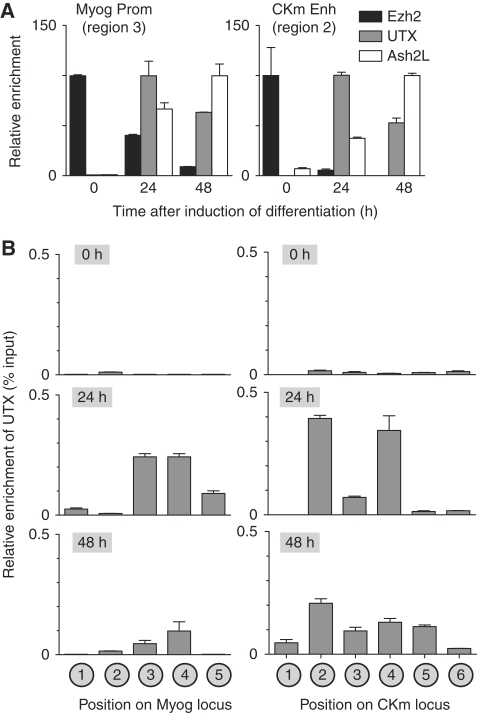
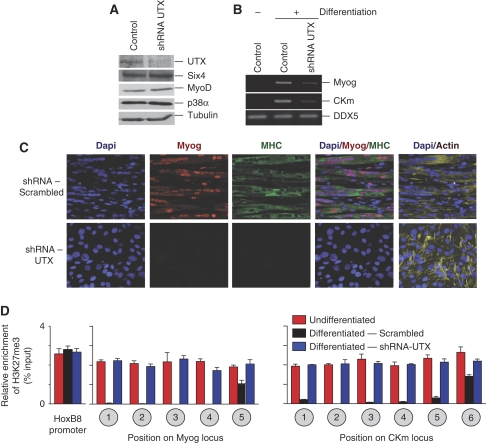
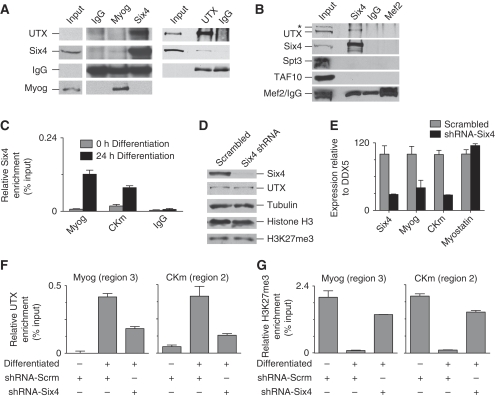
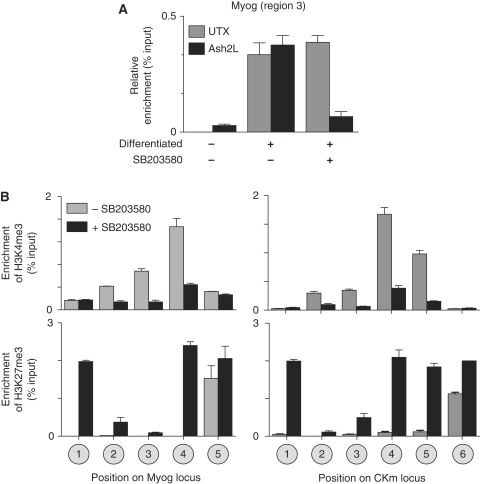
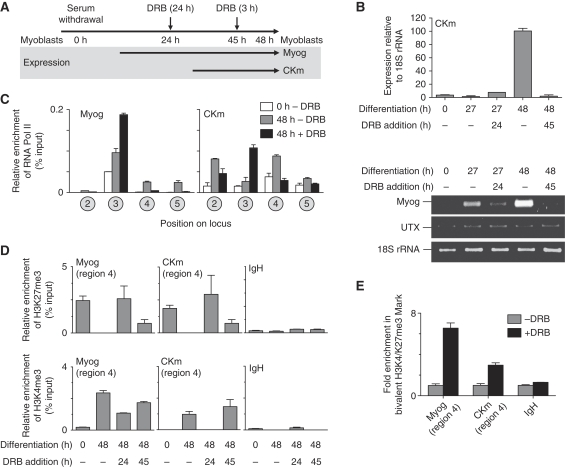
Polycomb (PcG) and Trithorax (TrxG) group proteins act antagonistically to establish tissue-specific patterns of gene expression. The PcG protein Ezh2 facilitates repression by catalysing histone H3-Lys27 trimethylation (H3K27me3). For expression, H3K27me3 marks are removed and replaced by TrxG protein catalysed histone H3-Lys4 trimethylation (H3K4me3). Although H3K27 demethylases have been identified, the mechanism by which these enzymes are targeted to specific genomic regions to remove H3K27me3 marks has not been established. Here, we demonstrate a two-step mechanism for UTX-mediated demethylation at muscle-specific genes during myogenesis. Although the transactivator Six4 initially recruits UTX to the regulatory region of muscle genes, the resulting loss of H3K27me3 marks is limited to the region upstream of the transcriptional start site. Removal of the repressive H3K27me3 mark within the coding region then requires RNA Polymerase II (Pol II) elongation. Interestingly, blocking Pol II elongation on transcribed genes leads to increased H3K27me3 within the coding region, and formation of bivalent (H3K27me3/H3K4me3) chromatin domains. Thus, removal of repressive H3K27me3 marks by UTX occurs through targeted recruitment followed by spreading across the gene.


Conflict of interest statement

The authors declare that they have no conflict of interest.

Figures

Figure 1
Figure 1
Methylation of histone H3 at the Myog and CKm genes during muscle differentiation. (A) Schematic representation of the Myog and CKm genes. P represents gene promoters, whereas E in the CKm gene represents enhancer (distal and intronic) elements. The encircled numbers above the schematic indicate the location on the gene where each of the different probe sets localize for analysis of ChIP studies. (B, C) Native ChIP analysis of the temporal (0, 24, and 48 h) changes in H3K27me3 or H3K4me3 enrichment across the Myog and CKm genes. Chromatin isolated from C2C12 cells at various stages of differentiation was subjected to immunopurification using either an anti-H3K27me3 or an anti-H3K4me3 antibody. After deproteination, immunopurified DNA was quantitated by qPCR using probes that recognize the different regions indicated in the schematic in Figure 1A.
Figure 2
Figure 2
UTX becomes associated with the Myogenin and CKm loci during C2C12 myogenesis. (A) Cross-linked chromatin from C2C12 cells (growing (0 h) or differentiated (24 or 48 h)) was subject to ChIP analysis using antibodies directed against UTX, Ezh2, or Ash2L. Immunopurified DNA was quantitated by qPCR using probes that recognize either the Myog promoter (left panel) or the distal enhancer of the CKm gene (right panel). To account for variability in IP efficiency of the three different antibodies, relative enrichment is plotted as a percentage of the maximal enrichment value observed for each factor individually during the 48 h time course after first calculating the absolute enrichment as a percentage of input chromatin. (B) X-ChIP analysis of the temporal (0, 24, and 48 h) changes in UTX enrichment across the Myog and CKm genes. Chromatin isolated from C2C12 cells at various stages of differentiation was subjected to immunopurification using an anti-UTX antibody. After deproteination, immunopurified DNA was quantitated by qPCR using probes that recognize the different regions indicated in the schematic in Figure 1A.
Figure 3
Figure 3
UTX mediates removal of the H3K27me3 mark at the Myog and CKm genes during myogenesis. (A) Western blot analysis of UTX knockdown in differentiating C2C12 cells. Nuclear extracts prepared from cells infected with lentivirus expressing shRNA that target UTX or control (scrambled) were separated by SDS–PAGE and analysed by western blot using the antibodies indicated. Each panel represent two lanes run on the same gel that have been cropped due to space constraints. Uncropped blots are shown in Supplementary Figure 7. (B) Gene expression in C2C12 cells after UTX knockdown. Primers specific for Myog, CKm, or the ubiquitously expressed DDX5 mRNA were used to amplify cDNA prepared from C2C12 cells under growth (−) or differentiation (+) conditions. Cells were infected with the non-targeted scrambled shRNA (control) or an UTX-targeted shRNA as indicated. (C) C2C12 cells infected with control (scrambled) or UTX-targeted shRNA were differentiated for 72 h and then examined by immunocytochemistry for actin (phalloidin stain), Myog, or MHC, whereas the DNA was stained with DAPI. Images were generated on a Zeiss 510 Confocal microscope using a × 40 lens. (D) Native ChIP analysis measured relative H3K27me3 levels at various regions within the Myog, CKm, or HoxB8 loci. C2C12 cells were infected with control (shRNA-scrambled) or UTX (shRNA-UTX) targeting shRNA, selected for infection using puromycin and then differentiated for 72 h. Positions on the locus correspond to regions indicated in the schematic in Figure 1A.
Figure 4
Figure 4
Six4 targets UTX to muscle-specific genes. (A) Proteins were immunoprecipitated from C2C12 nuclear extracts (24 h differentiation) using antibodies directed against UTX, Myog, Six4, or control IgG. Immunoprecipitated proteins, and 1/50th of input, were examined by western blot using the antibodies indicated. The left panel corresponds to an immunoprecipitation experiment, where the input and elution samples were processed together. The blot was cropped to remove lanes corresponding to flow-through fractions, and thus the input is separated from the elution fractions by a white bar but was run on the same gel and has the same exposure. Uncropped versions of the UTX and Six 4 analysis are shown in Supplementary Figure 6A. (B) Proteins were immunoprecipitated from nuclear extracts prepared from erythroleukemia cell line K562 using antibodies directed against Six4, Mef2, or control IgG. Immunoprecipitated proteins, and 1/10th of input, were examined by western blot using the antibodies indicated. The asterisk (*) marks a non-specific band observed from the UTX antibody in K562 cells. Mef2/IgG indicates that the two Mef2 bands observed in K562 cells co-migrated with IgG. To provide evidence that the stronger band observed in the Mef2 IP lane represents immunoprecipitated Mef2, we provide a shorter exposure of the blot in Supplementary Figure 6B where the slower migrating Mef2 band is distinguishable from the IgG. Note that all elution bands in this experiment migrate slightly higher than their counterpart in the input because the samples were eluted in a buffer containing urea. (C) Cross-linked chromatin from C2C12 cells (growing (0 h) or differentiated (24 h)) was subjected to ChIP analysis of Six4 binding. Immunopurified DNA was quantitated by qPCR using hydrolysis probes that recognize Myog (Region 3), CKm (Region 2), or IgH. (D) Western blot analysis of protein extracts isolated from cells infected with lentivirus expressing shRNA targeting Six4 or a scrambled control. Nuclear extracts prepared from cells infected with lentivirus expressing shRNA that target UTX or control (scrambled) were separated by SDS–PAGE and analysed by western blot using the antibodies indicated. Each panel represents two lanes run on the same gel that have been cropped due to space constraints. Uncropped blots are shown in Supplementary Figure 8. (E) RNA isolated from cells infected with lentivirus expressing Six4 targeting (or control) shRNA was reverse transcribed and subjected to qPCR analysis. Expression levels are expressed relative to DDX5. (F) Cross-linked chromatin from growing (−), or 24 h differentiated (+) C2C12 cells was subjected to ChIP analysis using antibodies directed against UTX. Immunopurified DNA was quantitated by qPCR using probes that recognize the promoter (Region 3) of Myog, or the upstream enhancer (Region 2) of CKm. (G) Native chromatin from growing (−), or 24 h differentiated (+) C2C12 cells was subject to ChIP analysis using antibodies directed against H3K27me3. Immunopurified DNA was quantitated by qPCR using probes that recognize the promoter (Region 3) of the Myog gene, or the upstream enhancer (Region 2) of CKm.
Figure 5
Figure 5
UTX recruitment to the Myog and CKm genes is p38 MAPK independent. (A) Cross-linked chromatin from growing (differentiation −), or 48 h differentiated (differentiation +) C2C12 cells that had been treated with or without the pharmacological inhibitor of p38 MAPK (SB203580) was subjected to ChIP analysis using antibodies recognizing either Ash2L or UTX. (B) Native ChIP analysis was performed on C2C12 cells that had been induced to differentiate for 48 h in the presence (+) or absence (−) of the p38 MAPK inhibitor SB203580. H3K4me3 (top panels) or H3K27me3 (bottom panels) ChIPs were analysed by qPCR using probes specific for position on the Myog or CKm locus as outlined in Figure 1A.
Figure 6
Figure 6
Induced stalling of Pol II at actively transcribed genes establishes bivalent chromatin domains. (A) Timeline for the addition of DRB during C2C12 differentiation. Arrows in the shaded box provide approximate times at which the Myog and CKm genes become expressed during myogenesis. (B) Differentiating C2C12 cells were treated with DRB as indicated. Random-primed cDNA was prepared from C2C12 cells and subjected to qPCR (top panel) using Taqman primer/probes sets that amplify CKm, or 18S rRNA or semi-quantitative PCR (lower panel) using primers specific for Myog, UTX, or 18S rRNA. (C) Cross-linked chromatin from C2C12 cells (growing (0 h), −DRB), or differentiated for 48 h in the presence (48 h, +DRB) or absence (48 h, −DRB) of DRB was subject to ChIP analysis using an antibody directed against Pol II (Rpb1). Immunopurified DNA was quantitated by qPCR using hydrolysis probes that recognize the regions indicated in the schematic in Figure 1A. (D) Chromatin was isolated from C2C12 cells in growth (0 h) or differentiation conditions (48 h) that had been treated with 100 μM DRB as indicated in the timeline in Figure 6A. (E) Native re-ChIP analysis was performed on the chromatin isolated from differentiating C2C12 cells (48 h) that have been incubated in the presence (+DRB) or absence (−DRB) of the inhibitor of transcriptional elongation DRB for 3 h. Chromatin immunoprecipitated with an anti-H3K4me3 antibody was purified, and re-immunoprecipitated using an anti-H3K27me3 antibody. Immunopurified DNA was quantitated by qPCR using hydrolysis probes that recognize the IgH gene or the +1000 region (Region 4) of the Myog or CKm genes.

References

    1. Agger K, Cloos PA, Christensen J, Pasini D, Rose S, Rappsilber J, Issaeva I, Canaani E, Salcini AE, Helin K (2007) UTX and JMJD3 are histone H3K27 demethylases involved in HOX gene regulation and development. Nature 449: 731–734 - PubMed
    1. Ahn SH, Kim M, Buratowski S (2004) Phosphorylation of serine 2 within the RNA polymerase II C-terminal domain couples transcription and 3′ end processing. Mol Cell 13: 67–76 - PubMed
    1. Barski A, Cuddapah S, Cui K, Roh TY, Schones DE, Wang Z, Wei G, Chepelev I, Zhao K (2007) High-resolution profiling of histone methylations in the human genome. Cell 129: 823–837 - PubMed
    1. Bentley DL, Groudine M (1986) A block to elongation is largely responsible for decreased transcription of c-myc in differentiated HL60 cells. Nature 321: 702–706 - PubMed
    1. Bergstrom DA, Penn BH, Strand A, Perry RL, Rudnicki MA, Tapscott SJ (2002) Promoter-specific regulation of MyoD binding and signal transduction cooperate to pattern gene expression. Mol Cell 9: 587–600 - PubMed

Publication types