. 2010 Mar;6(1):78-95.
doi: 10.1007/s11306-009-0178-y. Epub 2009 Sep 10.

Capillary electrophoresis mass spectrometry-based saliva metabolomics identified oral, breast and pancreatic cancer-specific profiles

Capillary electrophoresis mass spectrometry-based saliva metabolomics identified oral, breast and pancreatic cancer-specific profiles

Masahiro Sugimoto et al. Metabolomics. 2010 Mar.

Abstract

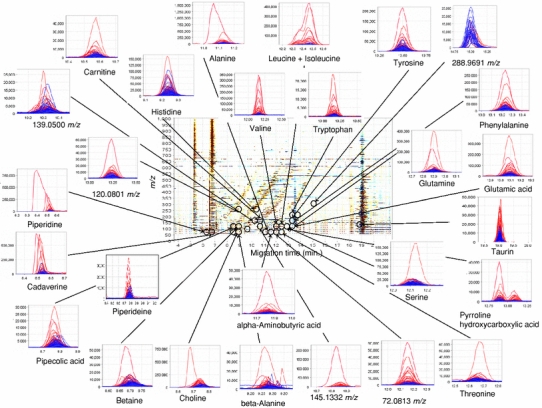
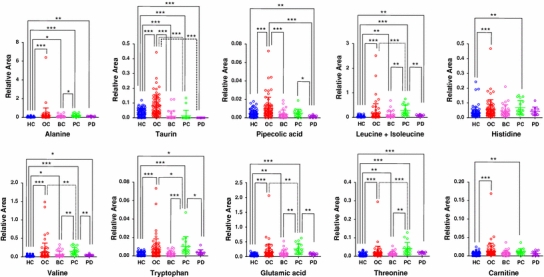
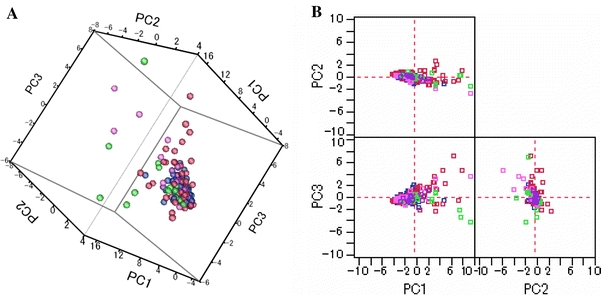
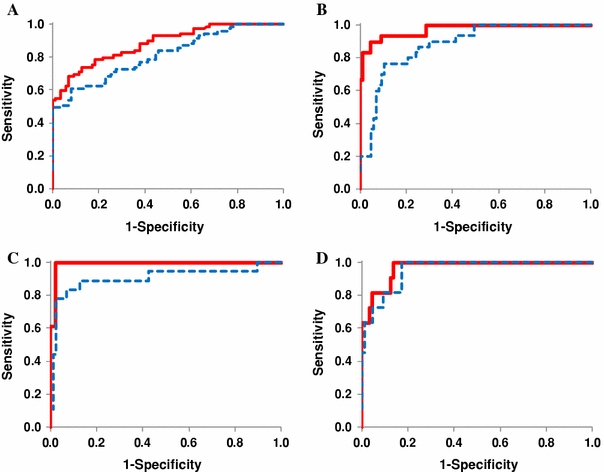
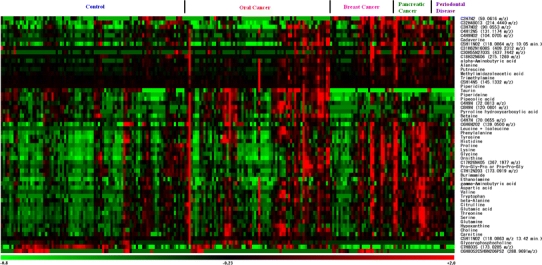
Saliva is a readily accessible and informative biofluid, making it ideal for the early detection of a wide range of diseases including cardiovascular, renal, and autoimmune diseases, viral and bacterial infections and, importantly, cancers. Saliva-based diagnostics, particularly those based on metabolomics technology, are emerging and offer a promising clinical strategy, characterizing the association between salivary analytes and a particular disease. Here, we conducted a comprehensive metabolite analysis of saliva samples obtained from 215 individuals (69 oral, 18 pancreatic and 30 breast cancer patients, 11 periodontal disease patients and 87 healthy controls) using capillary electrophoresis time-of-flight mass spectrometry (CE-TOF-MS). We identified 57 principal metabolites that can be used to accurately predict the probability of being affected by each individual disease. Although small but significant correlations were found between the known patient characteristics and the quantified metabolites, the profiles manifested relatively higher concentrations of most of the metabolites detected in all three cancers in comparison with those in people with periodontal disease and control subjects. This suggests that cancer-specific signatures are embedded in saliva metabolites. Multiple logistic regression models yielded high area under the receiver-operating characteristic curves (AUCs) to discriminate healthy controls from each disease. The AUCs were 0.865 for oral cancer, 0.973 for breast cancer, 0.993 for pancreatic cancer, and 0.969 for periodontal diseases. The accuracy of the models was also high, with cross-validation AUCs of 0.810, 0.881, 0.994, and 0.954, respectively. Quantitative information for these 57 metabolites and their combinations enable us to predict disease susceptibility. These metabolites are promising biomarkers for medical screening. ELECTRONIC SUPPLEMENTARY MATERIAL: The online version of this article (doi:10.1007/s11306-009-0178-y) contains supplementary material, which is available to authorized users.


Figures

Fig. 1
Fig. 1
A summary of the different metabolome profiles of cations obtained from CE-TOF-MS analyses of salivary metabolites from control (n = 87) and oral cancer samples (n = 69). The X and Y axes represent the migration time and the m/z value, respectively. The color density reflects the difference in intensity between the averaged control and oral cancer samples. Black circles indicate peaks that are significantly different between healthy control and oral cancer samples (P < 0.05; Steel–Dwass test). The small linked figures include overlaid electropherograms of control (blue) and oral cancer samples (red)
Fig. 2
Fig. 2
Representative dot plots for the relative area of detected metabolites in samples from all groups. The colored dots denote healthy controls (blue), oral (red), breast (pink), pancreatic cancer (green), and periodontal disease (purple). The Y- and X-axes denote the relative peak area (no units) and the group name, respectively. The horizontal, center long bars and the short top/bottom bars indicate the means and standard deviations, respectively. The stars indicates * P < 0.05, ** P < 0.01, and *** P < 0.001 (Steel–Dwass test). Only metabolites showing a significant difference between oral cancer and controls at P < 0.001 and matched with standard library are displayed. The dot plots of the other metabolites are shown in Supplementary Fig. S1
Fig. 3
Fig. 3
Score plots of principal components (PC) analyses. The subjects in all groups are shown in 3-dimensional (a) and 2-dimensional (b) plots without outliers. The cumulative proportions of the first, second and third PCs (PC1, PC2, and PC3) were 44.8, 57.6 and 67.0%. The same analyses presented for all datasets are shown in Supplementary Fig. S2
Fig. 4
Fig. 4
ROC curve analysis of the ability of salivary metabolites to discriminate between samples from patients with a oral (n = 69), b breast (n = 30) or c pancreatic cancer (n = 18), and d samples from patients with periodontal diseases (n = 11) and the controls (n = 87). The solid (red) and dotted (blue) ROC curves were obtained using the complete data as a training set and with a tenfold cross-validation, respectively. Using a cut-off probability of 50%, the calculated area under the ROC curves were 0.865 (0.810) for oral, 0.973 (0.881) for breast and 0.993 (0.944) for pancreatic cancer, and 0.969 (0.954) for periodontal diseases. The non-parenthetic values were obtained with the full-training data and parenthetic values by tenfold cross-validation
Fig. 5
Fig. 5
Heat map of 57 peaks showing significantly different levels (P < 0.05; Steel–Dwass test) between control samples (n = 87) and samples from patients with at least one disease (n = 128). Each row shows data for a specific metabolite and each column shows an individual. The colors correspond to the relative metabolite areas that were converted to Z-scores

References

    1. Ackerstaff E, Glunde K, Bhujwalla ZM. Choline phospholipid metabolism: A target in cancer cells? Journal of Cellular Biochemistry. 2003;90:525–533. doi: 10.1002/jcb.10659. - DOI - PubMed
    1. Aharoni A, Ric de Vos CH, Verhoeven HA, et al. Nontargeted metabolome analysis by use of Fourier transform ion cyclotron mass spectrometry. OMICS. 2002;6:217–234. doi: 10.1089/15362310260256882. - DOI - PubMed
    1. Ayers M, Symmans WF, Stec J, et al. Gene expression profiles predict complete pathologic response to neoadjuvant paclitaxel and fluorouracil, doxorubicin, and cyclophosphamide chemotherapy in breast cancer. Journal of Clinical Oncology. 2004;22:2284–2293. doi: 10.1200/JCO.2004.05.166. - DOI - PubMed
    1. Baran R, Kochi H, Saito N, et al. MathDAMP: A package for differential analysis of metabolite profiles. BMC Bioinformatics. 2006;7:530. doi: 10.1186/1471-2105-7-530. - DOI - PMC - PubMed
    1. Bolan PJ, Meisamy S, Baker EH, et al. In vivo quantification of choline compounds in the breast with 1H MR spectroscopy. Magnetic Resonance in Medicine. 2003;50:1134–1143. doi: 10.1002/mrm.10654. - DOI - PubMed