

Who wins and who loses? Public transfer accounts for US generations born 1850 to 2090
Affiliations
- PMID: 20300431
- PMCID: PMC2840408
Item in Clipboard
Who wins and who loses? Public transfer accounts for US generations born 1850 to 2090
Popul Dev Rev.
.
Abstract
Public transfer programs in industrial nations are thought to benefit the elderly through pension and health care programs at the expense of the young and future generations. However, this intergenerational picture changes if public education is also considered as a transfer program. We calculate the net present value (NPV) of benefits received minus taxes paid for US generations born 1850 to 2090. Surprisingly, all generations 1950 to 2050 are net gainers, while many current elderly are losers. Windfall gains from starting Social Security and Medicare partially offset windfall losses from starting public education, roughly consistent with the Becker-Murphy theory.
Figures

Present value at birth of Social Security benefits and taxes

Present value of Medicare benefits and taxes
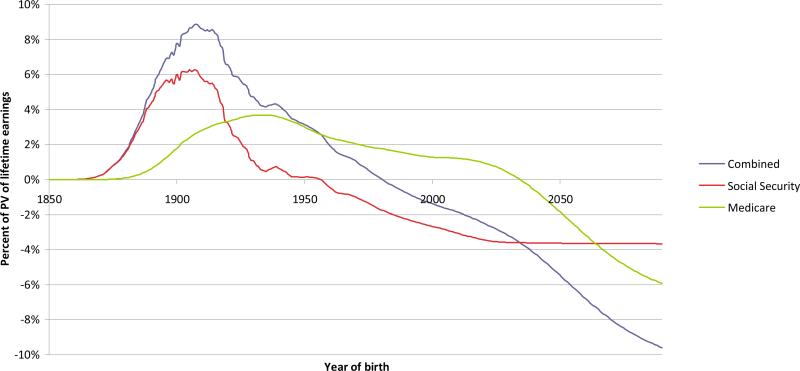
NPV at birth of expected lifetime Social Security and Medicare benefits as percent of lifetime earnings

NPV at birth of expected lifetime Social Security and Medicare as percent of lifetime earnings

Present value at birth of education benefits and taxes

NPV at birth of expected lifetime education benefits as percent of lifetime earnings

NPV at birth of expected lifetime education, Social Security, and Medicare benefits as percent of lifetime earnings
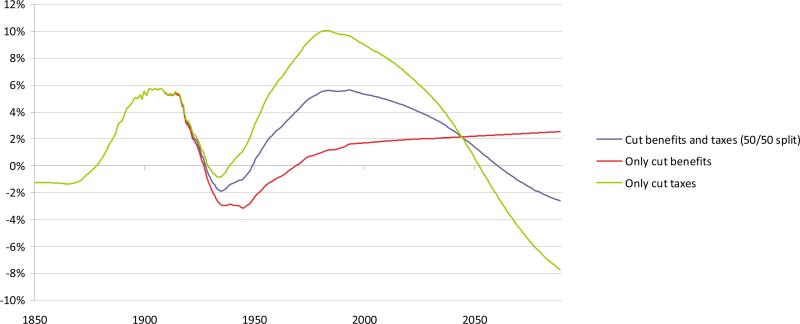
Budget balancing policy options: NPV at birth of expected lifetime education, Social Security, and Medicare benefits as percent of lifetime earnings (budget balancing options do not apply to education which is already assumed balanced)

Net present value of participating in all transfer systems by age in 2004 by budget balancing options (budget balancing options do not apply to education which is already assumed balanced)

Sensitivity tests of NPV using various discount rates

NPV at birth of expected lifetime public benefits as percent of lifetime earnings

Present value of lifetime earnings at birth

Net present value of participating in Social Security and Medicare by age in 2004
References
-
- Aaron Henry. The Social Insurance Paradox. Canadian Journal of Economics and Political Science. 1966;32(3):371–374.
-
- Auerbach Alan J., Gokhale Jagadeesh, Kotlikoff Laurence J. Generational Accounts: A Meaningful Alternative to Deficit Accounting. In: Bradford David., editor. Tax Policy and the Economy. MIT Press; Cambridge: 1991. pp. 55–110. for the National Bureau of Economic Research.
-
- Becker Gary S, Murphy Kevin. The Family and the State. Journal of Law and Economics. 1988;XXI:1–18.
-
- Bergstrom Theodore C., Hartman John L. Demographics and the Political Sustainability of Pay-As-You-Go Social Security. Vol. 1. Department of Economics, UCSB; Jan, 2005. p. 2005.
-
- et Montes A. Boldrin M. The Intergenerational State. Education and Pensions. Review of Economic Studies. 2005;72:651–664.
Grants and funding
LinkOut - more resources
Full Text Sources