. 2010 Mar 9:4:10.
doi: 10.3389/fnbeh.2010.00010. eCollection 2010.

Appetitive and aversive visual learning in freely moving Drosophila

Affiliations

Appetitive and aversive visual learning in freely moving Drosophila

Christopher Schnaitmann et al. Front Behav Neurosci. .

Abstract

To compare appetitive and aversive visual memories of the fruit fly Drosophila melanogaster, we developed a new paradigm for classical conditioning. Adult flies are trained en masse to differentially associate one of two visual conditioned stimuli (CS) (blue and green light as CS) with an appetitive or aversive chemical substance (unconditioned stimulus or US). In a test phase, flies are given a choice between the paired and the unpaired visual stimuli. Associative memory is measured based on altered visual preference in the test. If a group of flies has, for example, received a sugar reward with green light in the training, they show a significantly higher preference for the green stimulus during the test than another group of flies having received the same reward with blue light. We demonstrate critical parameters for the formation of visual appetitive memory, such as training repetition, order of reinforcement, starvation, and individual conditioning. Furthermore, we show that formic acid can act as an aversive chemical reinforcer, yielding weak, yet significant, aversive memory. These results provide a basis for future investigations into the cellular and molecular mechanisms underlying visual memory and perception in Drosophila.

Keywords: behavioral assay; chemical reinforcement; classical conditioning; method; vision.


Figures

Figure 1
Figure 1
Conditioning setup. (A) Scheme showing the principal components of the experimental setup. A Petri dish is illuminated from below using an LCD screen. Chemical solutions are presented on filter paper which is clamped on the dish by a plastic ring. A plastic pipe (inside coated with Fluon) connects the bottom dish and a lid (Petri dish). During training the cylinder is closed by an opaque lid (coated with Fluon), while during a test phase, a transparent lid enables recording flies from above. (B) The setup. From left to right: Petri dishes with filter papers (US-soaked, water-soaked and neutral from the left), cylinders closed with the opaque lids (top and bottom), the LCD screen with a plastic frame presenting test visual stimuli, cameras fixed by a stand. (C) Top view during the test phase. The flies are recorded with cameras from above (black rectangles).
Figure 2
Figure 2
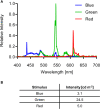
Visual stimulus properties. (A) Spectra of blue, green and red stimuli generated by the LCD screen. (B) Intensities of the different light stimuli.
Figure 3
Figure 3
Conditioning design. (A) Schematic drawing of the training and test situations. Two groups of flies are trained with different CS/US contingency: one group of flies is trained such that green light is paired with a US, whereas blue light is presented without any reinforcing stimulus (i.e., Green+/Blue−; first row); another group of flies is trained with the reversed contingency, i.e., Blue+/Green− (second row). After such training, flies are allowed to choose between the previously reinforced (CS+) and the non-reinforced stimulus (CS−). The difference of the stimulus preferences of the two groups in the test provides a measure of their memory (LI). (B) Conditioning protocol. After a pre-training period of 60 s, two differential visual stimuli (CS) were sequentially presented for 60 s with an inter-CS interval (ICSI) of typically 10–12 s. Only one of the two CSs was paired with the US (CS+) for 60 s. One training trial consisted of a CS+ and a CS− presentation.
Figure 4
Figure 4
Semi-automatic fly counting. Using ImageJ, flies in every region of interest (e.g., quadrant) were counted in every frame (automated using a macro). (A) The raw image (A1) was trimmed by manually selecting the test arena, and the image was gray-scaled (A2). A threshold was set to separate the flies from the background (A3; recognized objects marked in red). The “Analyze Particles” function was used to count the objects in each quadrant and frame (A4). (B) Histogram of the particle area distribution on a quadrant of one test video. Particles smaller than a certain size (arrow) were regarded as non-fly particles and excluded from counting.
Figure 5
Figure 5
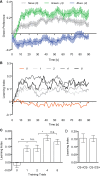
Appetitive visual associative memory. (A) Time course of the mean preference for the green stimulus of naïve flies (no training) and flies that received four training trials [two reciprocal groups: Green+/Blue− (green) and Blue+/Green− (blue). Flies that received a sugar reward with green light showed a higher preference for the green stimulus during the test phase than the reciprocal group having received the same reward with blue light. (B) Time course of the mean LIs of flies with (1, 2, 4 or 8) or without (0) training trials. (C) Effect of training repetition. Without training no significant memory could be found [one-sample t-test, t(13) = 1.159, P > 0.05], whereas all trained groups showed significant memory [one-sample t-test, one trial: t(17) = 4.632, P < 0.01; two trials: t(19) = 4.446, P < 0.01; four trials: t(19) = 9.490, P < 0.001; eight trials: t(17) = 8.242, P < 0.001]. Comparison among the groups with training (one to eight trials) revealed significant difference [one-way ANOVA, F(3, 72) = 3.512, P < 0.05]. The memory tended to increase with training repetition [e.g., comparison of groups trained with two and four trials: t-test, t(38) = 2.632, P < 0.05]. n = 18–20. (D) Effect of the order of CS presentation (four trials). The same data as in C were sorted to CS+/CS− and CS−/CS+ and reanalyzed. Either the first or second visual stimulus of each training trial was paired with the US. No significant difference was found between both groups [t-test, t(18) = 0.096, P > 0.05, n = 10]. In all the diagrams, bars (points) and error bars indicate means and the standard error of the mean, respectively. Asterisks indicate statistical significance (*P < 0.05; **P < 0.01; ***P < 0.001).
Figure 6
Figure 6
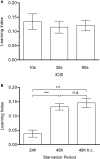
Inter-CS interval and starvation-dependency of visual appetitive memory. (A) The effect of duration of the inter-CS interval (ICSI). The interval lasted 10, 30 or 90 s. All groups showed significant memory [one-sample t-test, 10 s: t(19) = 4.925, P < 0.001; 30 s: t(19) = 5.476, P < 0.001; 90 s: t(17) = 6.394, P < 0.001] while no significant difference could be found among all groups [one-way ANOVA, F(2,55) = 0.1897, P > 0.05]. n = 18–20. (B) The effect of starvation periods. Flies were starved for 24, 48 or 48 h at high humidity conditions (h.c.). All groups showed significant memory [one-sample t-test, 24 h: t(17) = 3.154, P < 0.05; 48 h: t(15) = 11.87, P < 0.001; 48 h h.c.: t(12) = 9.022, P < 0.001], while longer starvation resulted in a significantly higher performance than short starvation [t-test, t(32) = 5.288, P < 0.001]. Different humidity conditions had no significant effect on the conditioned approach [t-test, t(27) = 0.7242, P > 0.05]. n = 13–16.
Figure 7
Figure 7
Single-fly vs. en masse conditioning. Learning indices of flies that undergo training and test in a group (Group) or individually (Individual) did not differ significantly from each other [Welch's t-test, t(27) = 0.7742, P > 0.05] despite significantly different variances [F-test, F(22,16) = 0.859, P < 0.001). Both groups showed significant memory [one-sample t-test, Group: t(16) = 7.802, P < 0.001; Individual: t(22) = 3.716, P < 0.01]. Note that the learning index of single-fly conditioning is based on the time spent on CS+ and CS−, whereas memory of en masse conditioning is measured with the differential distribution of flies. n = 17 and 23.
Figure 8
Figure 8
Memory retention. Learning indices of flies that were trained with four training trials and tested after 5 min., 1, 3 and 6 h. Significant memory was found up to 3 h after training [one-sample t-test, 5 min: t(34) = 5.891, P < 0.001; 1 h: t(34) = 3.358, P < 0.01; 3 h: t(29) = 3.008, P < 0.05]. After 6 h, no significant memory was detected anymore [one-sample t-test, t(15) = 0.2622, P > 0.05]. n = 16–35.
Figure 9
Figure 9
Avoidance of diverse chemical substances. Choices between different chemical solutions and the control (water) were given to naïve flies. (A) Acid avoidance. Flies were tested with formic acid (FA), acetic acid (AA) at 0.01–1 M, and phosphoric acid (PA) at 1–10 M. Strong avoidance was found for FA and AA at 1 M [one-sample t-test, AA 1 M: t(7) = 16.73, P < 0.001; FA 1 M: t(7) = 15.13, P < 0.001], whereas moderate avoidance, if at all, was observed at lower concentrations [one-sample t-test, AA 0.01 M: t(7) = 1.134, P > 0.05; AA 0.1 M: t(7) = 4.787, P < 0.05; FA 0.01 M: t(7) = 0.2669, P > 0.05; FA 0.1 M: t(7) = 1.358, P > 0.05]. PA did not evoke a significant avoidance at any of the tested concentrations [one-sample t-test, PA 1 M: t(7) = 1.356, P > 0.05; PA 2 M: t(7) = 0.2009, P > 0.05; PA 10 M: t(7) = 0.5641, P > 0.05]. n = 8. (B) Avoidance of NaCl (6 M) and quinine (0.1 M). Both substances were assayed with dry or wet filter paper. No avoidance of the flies to these substances at any condition was found [one-sample t-test, NaCl dry: t(9) = 0.3021, P > 0.05; NaCl wet: t(9) = 1.872, P > 0.05; quinine dry: t(9) = 1.353, P > 0.05; quinine wet: t(7) = 1.959, P > 0.05]. n = 10.
Figure 10
Figure 10
Aversive visual associative memory. Memories of flies that were trained with formic acid or acetic acid instead of sugar. The same training protocol was applied as for appetitive conditioning. Conditioned avoidance was tested in the presence or absence of the respective reinforcer (white or black bars, respectively). Significant memory was only found with formic acid when formic acid was present during the test [one-sample t-test, t(39) = 3.714, P < 0.01]. No significant memory could be detected without a reinforcer in the test or using acetic acid as reinforcer [one-sample t-test, FA No US @ Test: t(39) = 0.6058, P > 0.05; AA US @ Test: t(19) = 0.2170, P > 0.05; AA No US @ Test: t(19) = 0.2937, P > 0.05]. n = 20–40.

Similar articles

Cited by

References

    1. Acevedo S. F., Froudarakis E. I., Kanellopoulos A., Skoulakis E. M. (2007). Protection from premature habituation requires functional mushroom bodies in Drosophila. Learn. Mem. 14, 376–38410.1101/lm.566007 - DOI - PMC - PubMed
    1. Bicker G., Reichert H. (1978). Visual learning in a photoreceptor degeneration mutant of Drosophila melanogaster. J. Comp. Physiol. A 127, 29–3810.1007/BF00611923 - DOI
    1. Brembs B., Christiansen F., Pfluger H. J., Duch C. (2007). Flight initiation and maintenance deficits in flies with genetically altered biogenic amine levels. J. Neurosci. 27, 11122–1113110.1523/JNEUROSCI.2704-07.2007 - DOI - PMC - PubMed
    1. Chabaud M. A., Isabel G., Kaiser L., Préat T. (2009). Social facilitation of long-lasting memory retrieval in Drosophila. Curr. Biol. 19, 1654–165910.1016/j.cub.2009.08.017 - DOI - PubMed
    1. Colomb J., Kaiser L., Chabaud M. A., Préat T. (2009). Parametric and genetic analysis of Drosophila appetitive long-term memory and sugar motivation. Genes Brain Behav. 8, 407–41510.1111/j.1601-183X.2009.00482.x - DOI - PubMed

LinkOut - more resources