

A monomeric variant of insulin degrading enzyme (IDE) loses its regulatory properties
- PMID: 20300529
- PMCID: PMC2838795
- DOI: 10.1371/journal.pone.0009719
A monomeric variant of insulin degrading enzyme (IDE) loses its regulatory properties
Abstract
Background: Insulin degrading enzyme (IDE) is a key enzyme in the metabolism of both insulin and amyloid beta peptides. IDE is unique in that it is subject to allosteric activation which is hypothesized to occur through an oligomeric structure.
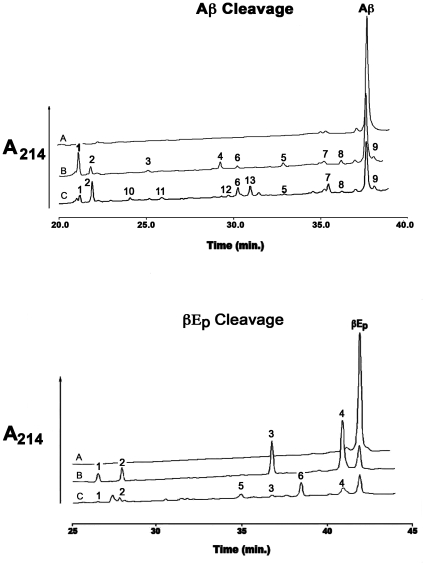
Methodology/principal findings: IDE is known to exist as an equilibrium mixture of monomers, dimers, and higher oligomers, with the dimer being the predominant form. Based on the crystal structure of IDE we deleted the putative dimer interface in the C-terminal region, which resulted in a monomeric variant. Monomeric IDE retained enzymatic activity, however instead of the allosteric behavior seen with wild type enzyme it displayed Michaelis-Menten kinetic behavior. With the substrate Abz-GGFLRKHGQ-EDDnp, monomeric IDE retained approximately 25% of the wild type activity. In contrast with the larger peptide substrates beta-endorphin and amyloid beta peptide 1-40, monomeric IDE retained only 1 to 0.25% of wild type activity. Unlike wild type IDE neither bradykinin nor dynorphin B-9 activated the monomeric variant of the enzyme. Similarly, monomeric IDE was not activated by polyphosphates under conditions in which the activity of wild type enzyme was increased more than 50 fold.
Conclusions/significance: These findings serve to establish the dimer interface in IDE and demonstrate the requirement for an oligomeric form of the enzyme for its regulatory properties. The data support a mechanism where the binding of activators to oligomeric IDE induces a conformational change that cannot occur in the monomeric variant. Since a conformational change from a closed to a more open structure is likely the rate-determining step in the IDE reaction, the subunit induced conformational change likely shifts the structure of the oligomeric enzyme to a more open conformation.
Conflict of interest statement
Figures


Similar articles
-
Substrate activation of insulin-degrading enzyme (insulysin). A potential target for drug development.J Biol Chem. 2003 Dec 12;278(50):49789-94. doi: 10.1074/jbc.M308983200. Epub 2003 Oct 2. J Biol Chem. 2003. PMID: 14527953
-
Mutation of active site residues of insulin-degrading enzyme alters allosteric interactions.J Biol Chem. 2005 May 6;280(18):17701-6. doi: 10.1074/jbc.M501896200. Epub 2005 Mar 3. J Biol Chem. 2005. PMID: 15749695
-
Proteolytic fragments of insulysin (IDE) retain substrate binding but lose allosteric regulation.Biochemistry. 2006 Dec 19;45(50):15085-91. doi: 10.1021/bi061298u. Biochemistry. 2006. PMID: 17154546 Free PMC article.
-
Insulin-degrading enzyme: structure-function relationship and its possible roles in health and disease.Curr Pharm Des. 2009;15(31):3644-55. doi: 10.2174/138161209789271799. Curr Pharm Des. 2009. PMID: 19925417 Review.
-
Insulin, insulin-degrading enzyme and amyloid-beta peptide in Alzheimer's disease: review and hypothesis.Neurobiol Aging. 2006 Feb;27(2):190-8. doi: 10.1016/j.neurobiolaging.2005.01.004. Epub 2005 Feb 17. Neurobiol Aging. 2006. PMID: 16399206 Review.
Cited by
-
Intracranial injection of AAV expressing NEP but not IDE reduces amyloid pathology in APP+PS1 transgenic mice.PLoS One. 2013;8(3):e59626. doi: 10.1371/journal.pone.0059626. Epub 2013 Mar 28. PLoS One. 2013. PMID: 23555730 Free PMC article.
-
Molecular dissection of novel trafficking and processing of the Toxoplasma gondii rhoptry metalloprotease toxolysin-1.Traffic. 2012 Feb;13(2):292-304. doi: 10.1111/j.1600-0854.2011.01308.x. Epub 2011 Nov 29. Traffic. 2012. PMID: 22035499 Free PMC article.
-
Structure based discovery of small molecules to regulate the activity of human insulin degrading enzyme.PLoS One. 2012;7(2):e31787. doi: 10.1371/journal.pone.0031787. Epub 2012 Feb 15. PLoS One. 2012. PMID: 22355395 Free PMC article.
-
Ensemble cryoEM elucidates the mechanism of insulin capture and degradation by human insulin degrading enzyme.Elife. 2018 Mar 29;7:e33572. doi: 10.7554/eLife.33572. Elife. 2018. PMID: 29596046 Free PMC article.
-
Modulation of Insulin Sensitivity by Insulin-Degrading Enzyme.Biomedicines. 2021 Jan 17;9(1):86. doi: 10.3390/biomedicines9010086. Biomedicines. 2021. PMID: 33477364 Free PMC article. Review.
References
-
- Goldstein BJ, Livingston JN. Insulin degradation by insulin target cells. Metabolism. 1981;30:825–835. - PubMed
-
- Yonezawa K, Yokono K, Yaso S, Hari J, Amano K, et al. Degradation of insulin by insulin-degrading enzyme and biological characteristics of its fragments. Endocrinology. 1986;118:1989–1996. - PubMed
-
- Hari J, Shii K, Roth RA. In vivo association of [125I]-insulin with a cytosolic insulin-degrading enzyme: detection by covalent cross-linking and immunoprecipitation with a monoclonal antibody. Endocrinology. 1987;120:829–831. - PubMed
-
- Fakhrai-Rad H, Nikoshkov A, Kamel A, Fernstrom M, Zierath JR, et al. Insulin-degrading enzyme identified as a candidate diabetes susceptibility gene in GK rats. Hum Mol Genet. 2000;9:2149–2158. - PubMed
Publication types
MeSH terms
Substances
Grants and funding
LinkOut - more resources
Full Text Sources
