. 2010 Mar 12;6(3):e1000705.
doi: 10.1371/journal.pcbi.1000705.

Detailed simulations of cell biology with Smoldyn 2.1

Affiliations

Detailed simulations of cell biology with Smoldyn 2.1

Steven S Andrews et al. PLoS Comput Biol. .

Abstract

Most cellular processes depend on intracellular locations and random collisions of individual protein molecules. To model these processes, we developed algorithms to simulate the diffusion, membrane interactions, and reactions of individual molecules, and implemented these in the Smoldyn program. Compared to the popular MCell and ChemCell simulators, we found that Smoldyn was in many cases more accurate, more computationally efficient, and easier to use. Using Smoldyn, we modeled pheromone response system signaling among yeast cells of opposite mating type. This model showed that secreted Bar1 protease might help a cell identify the fittest mating partner by sharpening the pheromone concentration gradient. This model involved about 200,000 protein molecules, about 7000 cubic microns of volume, and about 75 minutes of simulated time; it took about 10 hours to run. Over the next several years, as faster computers become available, Smoldyn will allow researchers to model and explore systems the size of entire bacterial and smaller eukaryotic cells.


Conflict of interest statement

The authors have declared that no competing interests exist.

Figures

Figure 1
Figure 1. Example Smoldyn models.
(A) Model of Escherichia coli chemotaxis, adapted from work by Lipkow and Odde . Receptors are clustered at the left cell pole, unphosphorylated CheY messenger proteins are shown in black and phosphorylated CheY are in red. This simulation showed that the combination of a spatially segregated kinase-phosphatase system and phosphorylation-dependent diffusion coefficients can create stable protein gradients. (B) Simulated track of a diffusing lipid molecule, which is on a membrane that is divided into “corrals” by underlying actin filaments, shown with black lines. The track is shown in red, then green, blue, and yellow to illustrate that lipids tend to fully explore individual corrals before hopping to adjacent corrals. Actin data are from Morone et al. . (C) Model of a dendritic spine, showing GFP-tagged calcium calmodulin dependent kinase II proteins (CaMKII) in green and molecules of the postsynaptic density at the spine tip in yellow, adapted from work by Khan et al. . The authors used these simulations to analyze fluorescence microscopy data and to investigate CaMKII sequestration upon synaptic excitation.
Figure 2
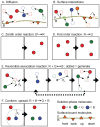
Figure 2. Algorithms used in Smoldyn.
The bottom-right panel is a key. The front and back sides of surfaces are noted with ‘F’ and ‘B’, respectively. (A) Diffusion for solution and surface-bound molecules; note that there is no excluded volume. (B) From left to right, interactions between molecules and surfaces are: reflection, absorption, transmission, adsorption, desorption, and surface-state conversion. (C) Zeroth order chemical reaction. (D) First order chemical reaction. (E) In these sequential association and dissociation reactions, αb is the binding radius and αu is the unbinding radius. The last frame shows two possible scenarios, which are the geminate recombination of the dissociation products (dashed arrows) or diffusion of these products away from each other (solid arrows). (F) Conformational spread reaction with interaction distance rc.
Figure 3
Figure 3. Tests of Smoldyn accuracy.
Each panel presents simulation results with points and theoretical results for the same parameters with solid lines. Where present, different shape points represent simulation data for different rates. Inset panels present fluctuations of the same simulation data shown in the main panels, with parameters that are reduced so as to highlight the fluctuations and provide meaningful comparisons between data sets. Here, solid lines represent theoretical expectation values and dashed lines are drawn one standard deviation, analytically calculated from theory, above and below the expectation values. Configuration files and analytic calculations are included with Text S2. (A) Mean square displacements of three populations of freely diffusing molecules that have the listed diffusion coefficients. (B) First order decay reactions (A → Ø) of three populations of molecules that have the listed reaction rate constants. The reduced reaction rate is the reaction rate per molecule per unit of reduced time. (C) Bimolecular association and decay reaction between A and B molecules (A + B → Ø), using the same parameters that are presented in Figure 7 of Andrews and Bray . The reduced reaction rate is the reaction rate per A molecule. (D) Adsorption of molecules that are uniformly distributed initially to planar surfaces with the listed adsorption coefficients. The inset panel shows fluctuations in the κ = 5 µm s−1 simulation data.
Figure 4
Figure 4. A model of the effect of the Bar1 protease on yeast signaling.
(A) A snapshot of the system shown at steady state and with a target cell release of about 4×10⁴ α-factor molecules per second. It is surrounded by a triangulated spherical boundary which absorbs molecules with Smoldyn's “unbounded-emitter” method. The central sphere is a MAT a cell, light grey spheres are challenger MATα cells, and the dark grey sphere on the right is the target MATα cell. Blue dots are unliganded GPCRs, red are GPCR-α complexes, green are Bar1 molecules, and black are α-factor molecules. Model details are presented in Text S4. (B) Average receptor occupancy for Bar1+ and Bar1 cells (see legend). These data fit well to Hill functions with unit cooperativity but with a 5-fold difference in their EC50s. (C) Average gradient of GPCR-α complexes across the surface of the MAT a cell. It is scaled so that 0 represents no gradient and 1 represents the maximum possible gradient. (D) Angle difference between vectors that point from the MAT a cell center to (i) the average position of the GPCR-α complexes and to (ii) the target cell center, averaged over all time points. This figure shows that although Bar1 decreases α-factor binding to the MAT a cell, it increases the MAT a cell's ability to locate the target MATα cell.

References

    1. Alves R, Antunes F, Salvador A. Tools for kinetic modeling of biochemical networks. Nat Biotechnol. 2006;24:667–672. - PubMed
    1. Delbrück M. The burst size distribution in the growth of bacterial viruses (bacteriophages). J Bact. 1945;50:131–135. - PubMed
    1. Berg HC, Brown DA. Chemotaxis in Escherichia coli analysed by three-dimensional tracking. Nature. 1972;239:500–504. - PubMed
    1. Colman-Lerner A, Gordon A, Serra E, Chin T, Resnekov O, et al. Regulated cell-to-cell variation in a cell-fate decision system. Nature. 2005;437:699–706. - PubMed
    1. Levin MD, Morton-Firth CJ, Abouhamad WN, Bourret RB, Bray D. Origin of individual swimming behavior in bacteria. Biophys J. 1998;74:175–181. - PMC - PubMed

Publication types