. 2010 Mar 12;6(3):e1000878.
doi: 10.1371/journal.pgen.1000878.

Arginylation-dependent neural crest cell migration is essential for mouse development

Affiliations

Arginylation-dependent neural crest cell migration is essential for mouse development

Satoshi Kurosaka et al. PLoS Genet. .

Abstract

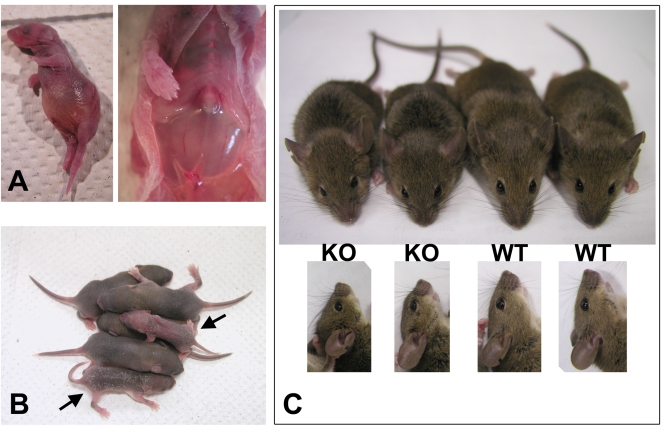
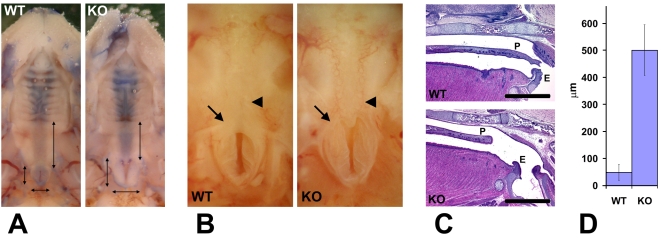
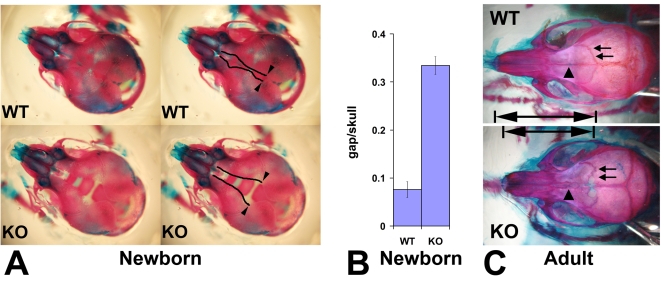
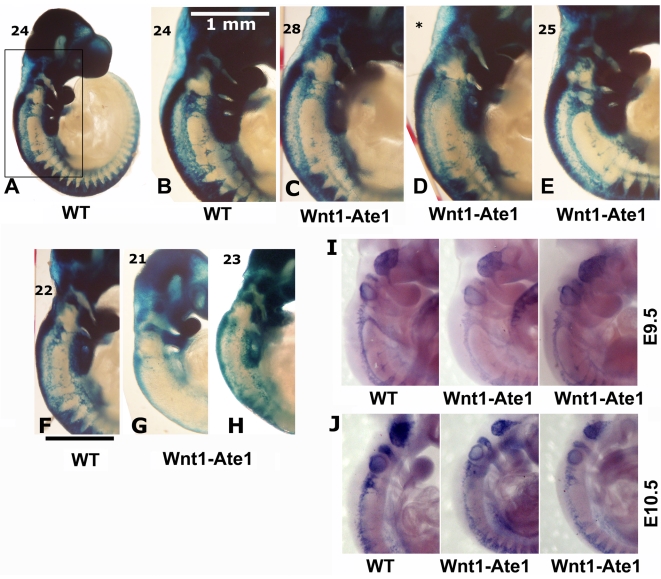
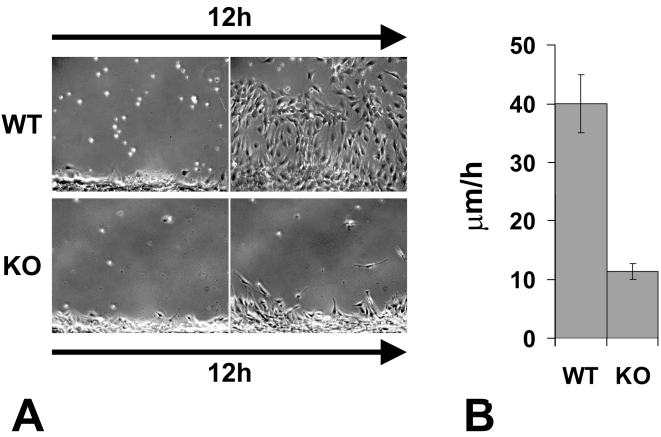
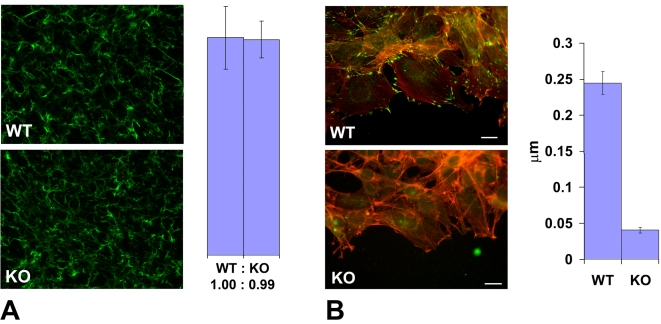
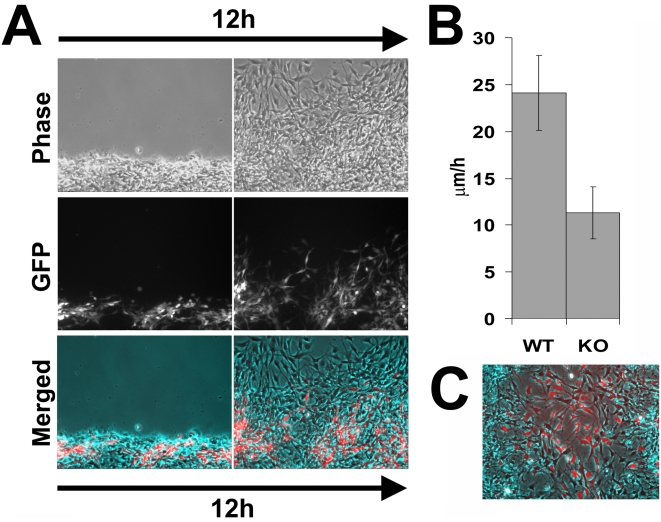
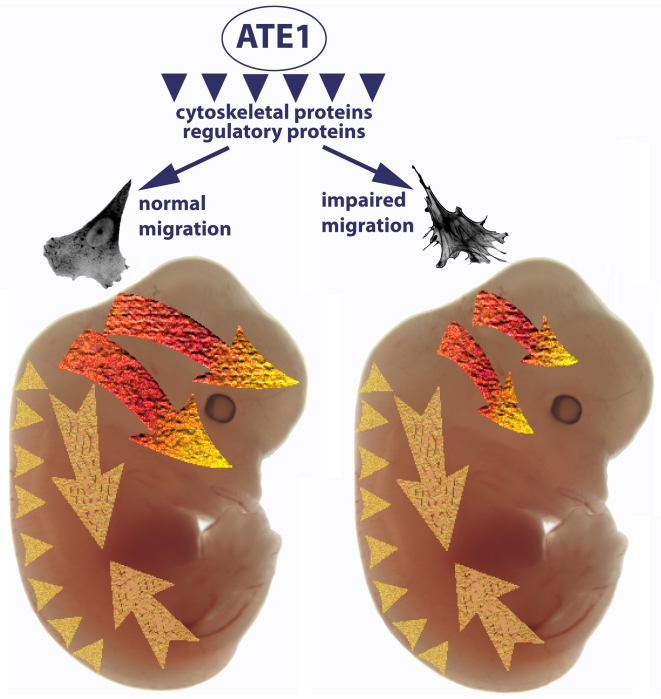
Coordinated cell migration during development is crucial for morphogenesis and largely relies on cells of the neural crest lineage that migrate over long distances to give rise to organs and tissues throughout the body. Recent studies of protein arginylation implicated this poorly understood posttranslational modification in the functioning of actin cytoskeleton and in cell migration in culture. Knockout of arginyltransferase (Ate1) in mice leads to embryonic lethality and severe heart defects that are reminiscent of cell migration-dependent phenotypes seen in other mouse models. To test the hypothesis that arginylation regulates cell migration during morphogenesis, we produced Wnt1-Cre Ate1 conditional knockout mice (Wnt1-Ate1), with Ate1 deletion in the neural crest cells driven by Wnt1 promoter. Wnt1-Ate1 mice die at birth and in the first 2-3 weeks after birth with severe breathing problems and with growth and behavioral retardation. Wnt1-Ate1 pups have prominent defects, including short palate and altered opening to the nasopharynx, and cranial defects that likely contribute to the abnormal breathing and early death. Analysis of neural crest cell movement patterns in situ and cell motility in culture shows an overall delay in the migration of Ate1 knockout cells that is likely regulated by intracellular mechanisms rather than extracellular signaling events. Taken together, our data suggest that arginylation plays a general role in the migration of the neural crest cells in development by regulating the molecular machinery that underlies cell migration through tissues and organs during morphogenesis.


Conflict of interest statement

The authors have declared that no competing interests exist.

Figures

Figure 1
Figure 1. Wnt1-Ate1 mice have perinatal lethality.
(A) A Wnt1-Ate1 pup that died at birth from breathing defects as shown in the Video S1. In such pups labored breathing leads to bloating (left) and prominent air accumulation in the stomach (right). (B) Wnt1-Ate1 pups that survive after birth (indicated by arrows) shown at postnatal day 5 (P5) are smaller than their wild-type littermates and are significantly less active at day 9 (Video S2), suggesting growth and behavioral retardation. (C) Wnt1-Ate1 (KO) mice that survive to adulthood are smaller than control (WT, top) and have short snouts and abnormally shaped skulls (bottom).
Figure 2
Figure 2. Wnt1-Ate1 mice have palate defects.
(A) Observation of the roof of the mouth of control (WT) and Wnt1-Ate1 (KO) newborn pups at P0 shows a shorter soft palate area (longer vertical arrow on the right in each image) and an enlarged nasopharynx entrance (two shorter perpendicular arrows on the left and bottom in each image). Heads have been contrasted with trypan blue dye for better observation. 5 wild-type and 5 Wnt1-Ate1 pups were analyzed. (B) Closer view of the nasopharynx entrance (arrow) and the surrounding area in a control (WT) and aWnt1-Ate1 (KO) newborn pup at P0 with the missing soft palate (arrowhead). (C) Sagittal sections through the palate areas of the control (WT) and Wnt1-Ate1 (KO) newborn pups at P0. While in control the soft palate (P) reaches all the way to the epiglottis (E), in the mutant the palate is shorter and leaves a large gap of exposed tissue at the back of the throat. Scale bar, 1 mm. 4 wild-type and 5 Wnt1-Ate1 pups were analyzed. (D) Quantification of the distance from the end of the palate to the epiglottis in all the examined pups at P0 (4 wild-type and 5 mutants). In wild-type, the average distance was 48.6+/−28.9 (SEM), and in the mutants this number increased over 10-fold to 501.0+/−93.7 (SEM), indicating a significant overall shortening of the tissue of the soft palate.
Figure 3
Figure 3. Wnt1-Ate1 mice have defects in the frontal bones.
(A) Top view of the skulls of the control (WT, top) and Wnt1-Ate1 (KO, bottom) pups at P0 stained with alizarin red S and alcian blue 8GS show a significant gap on top of the skull in the mutant pups, due to the significantly reduced frontal bones. Left images show the same pictures as those shown on right with the edges of the gap outlined. Arrowheads indicate the point of the opening of the gap used for the measurements shown in (B). (B) Measurement of the ratio of the gap width to skull width along the same axis (gap/skull) at P0 show that in the mutant (KO) unlike the control (WT) the gap occupies on average more than 1/3 of the skull (ratio 0.334+/−0.018 (SEM, n = 5) in the mutant vs. 0.076+/−0.016 (SEM, n = 12) in wild-type). (C) Skulls of adult Wnt1-Ate1 mice compared to their littermate controls show frontal bone abnormalities, including abnormal shape, incomplete cranial suture (arrows), and abnormal suture between the frontal bones (arrowheads). 2 wild-type and 2 mutant animals were analyzed.
Figure 4
Figure 4. Wnt1-Ate1 mice have defects in neural crest cell migration.
(A–H) X-gal staining of E9.5 control (A,B) and Wnt1-Ate1 (C–E) embryos derived from Wnt1-Ate1-R26R mouse line grouped by somite count (indicated on the top left for each embryo). A, lower magnification image of a control embryo at 24 somite stage. (B–E), back areas of different wild-type and Wnt1-Ate1 embryos with higher somite count, corresponding to the region boxed in (A), showing different neural crest migration patterns as described in the text. For Wnt1-Ate1, three littermates are shown, illustrating different pattern and severity of defects as described in the text; asterisk indicates the embryo, for which somite count was not performed and the staging relied on the comparison with its littermates shown on both sides. (F–H), back areas of wild-type and Wnt1-Ate1 embryos with lower somite count. Bar, 1 mm, for the images shown in (B–H). 10 wild-type and 10 mutant embryos were analyzed. See Figure S14 for whole embryo views. (I,J) In situ hybridization of E9.5 (I) and E10.5 (J) control and Wnt1-Ate1 embryos using Sox10 neural crest marker. 2 wild-type and 2 Wnt1-Ate1 embryos were analyzed for each developmental stage. See Figure S15 for whole embryo views.
Figure 5
Figure 5. Knockout of the arginyltransferase Ate1 in the mesenchymal cells results in a significant reduction in their migration speeds.
(A) The first and the last frame of a time lapse series of a wild-type (WT) and Ate1 knockout (KO) fibroblast monolayer moving into the wound. See Video S3 and Video S4 for the corresponding time lapse series. Bar, 200 µm. (B) Quantification of the average migration speed in wild-type (WT) and Ate1 knockout (KO) cultures calculated from the time lapse series similar to the one shown in (A). In wild-type average migration speed was 39.97+/−4.90(SEM), n = 2; in the knockout the speed was almost 4 times slower at 11.34+/−1.32(SEM), n = 4.
Figure 6
Figure 6. Ate1 knockout affects cell attachment to the substrate via intracellular and not extracellular mechanisms.
(A) Left, extracellular fibronectin staining in a dense monolayer of wild-type (WT) and Ate1 knockout (KO) cultured fibroblasts shows no difference between the two cultures. Right, quantification of the fibronectin level in the two cultures measured as average gray value in the entire field of view confirms that there is no difference between WT and KO cells in the amount of extracellular fibronectin. Bars show the ratio between WT and KO and error bars represent the average of the measurements in 10 different fields of view in each culture. (B) Left, an overlay of the fluorescence staining of the edge of the cell monolayer moving into the wound co-stained with rhodamine-phalloidin (red) to visualize the actin filaments and anti-paxillin (green) to visualize the focal adhesions. Right, quantification of the number of focal adhesions per µm of the wound edge shows that the number of prominent focal adhesion in wild-type exceeds that in the knockout by over 5-fold. Error bars represent the measurements in 21 and 18 different images in WT and KO, respectively. Bar, 20 µm.
Figure 7
Figure 7. Ate1 knockout cells co-cultured with wild-type move with speeds closer to the wild-type cells than when cultured individually.
(A) Phase contrast (top), fluorescence (middle), and overlayed (bottom) images of the first and last frame of a 12-hour time lapse series of GFP-labeled Ate1 knockout cells co-cultured with wild-type moving into the wound. Wild-type cells quickly bypass the Ate1 knockout cells initially found at the wound edge and ‘lead’ for the rest of the time lapse, consistent with their faster migration speeds. Ate1 knockout cells lag behind, often ‘riding’ on the wild-type cells rather than moving on their own, however they are able to cover greater distance over the 12 hours than in individual cultures (Figure 5). See Video S5 for the merged time lapse. Bar, 200 µm. (B) Average speeds of the wild-type (WT, unlabeled) and Ate1 knockout (KO, GFP-labeled) cells moving in co-culture show that the difference between the speeds of the two cell types is much less than in individual cultures. Average migration speed of wild-type cells was 24.12+/−4.00(SEM), and the knockout 11.29+/−2.78(SEM), n = 4. (C) Last frame of a 12-hour time lapse series of GFP-labeled wild-type cells co-cultured with Ate1 knockout cells moving into the wound, overlayed similarly to that shown in (A).
Figure 8
Figure 8. Ate1-dependent impairment of cell migration preferentially affects cranial neural crest-dependent morphogenesis.
Arginyltransferase Ate1 has been found to arginylate multiple intracellular targets, including a large subset of cytoskeletal proteins and a smaller subset of regulatory proteins. A combination of these arginylation events results in impairment of cell adhesion and the cytoskeletal structures that lead to slower migration speeds. The three migrating subpopulations of Wnt1-expressing cells—cranial neural crest (bright orange-yellow arrows), vagal and sacral neural crest (large pale yellow arrows), and trunk neural crest (pale yellow arrowheads)—are differentially affected by this impaired migration. In the trunk, cells migrating over short distances with relatively slow speeds are apparently capable of getting to their destinations despite the Ate1-dependent defects. Cells of the vagal and sacral neural crest migrate individually along the expanding gut; while they are believed to be the fastest migrating neural crest cells, our data suggest that this migration may be greatly aided by the expanding surrounding tissues and that Ate1-dependent impairments do not affect the final positioning of these cells in the enteric nervous system. Cranial neural crest giving rise to some of the skull bones (top arrow) and palate (bottom arrow) migrate with steady speeds similar to those observed in culture. Migration of these cells is heavily affected by Ate1 knockout, resulting in morphogenic defects in multiple craniofacial structures.

References

    1. Bronner-Fraser M, Fraser SE. Cell lineage analysis of the avian neural crest. Development. 1991;Suppl 2:17–22. - PubMed
    1. Fraser SE. Pattern formation in the vertebrate nervous system. Curr Opin Genet Dev. 1991;1:217–220. - PubMed
    1. Le Douarin NM. The Neural Crest (Developmental and Cell Biology Series): Cambridge University Press. 1983.
    1. Tucker RP. Neural crest cells: a model for invasive behavior. Int J Biochem Cell Biol. 2004;36:173–177. - PubMed
    1. Saint-Jeannet J-P, editor. New Yory, NY: Springer Science + Business Media, LLC; 2006. Neural Crest Induction and Differentiation.

Publication types

MeSH terms

LinkOut - more resources