. 2010 May 3;11(7):972-7.
doi: 10.1002/cbic.201000041.

Photocaged t7 RNA polymerase for the light activation of transcription and gene function in pro- and eukaryotic cells

Affiliations

Photocaged t7 RNA polymerase for the light activation of transcription and gene function in pro- and eukaryotic cells

Chungjung Chou et al. Chembiochem. .

Abstract

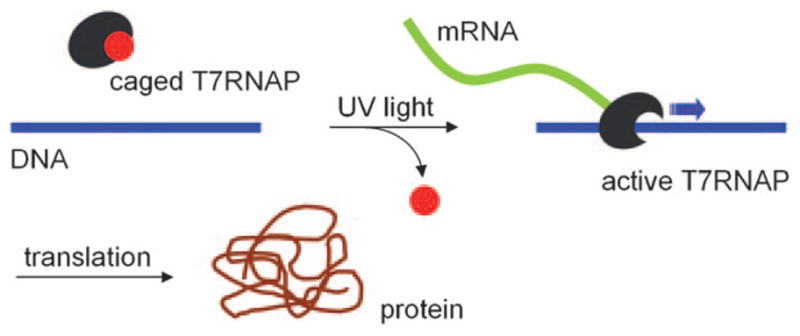
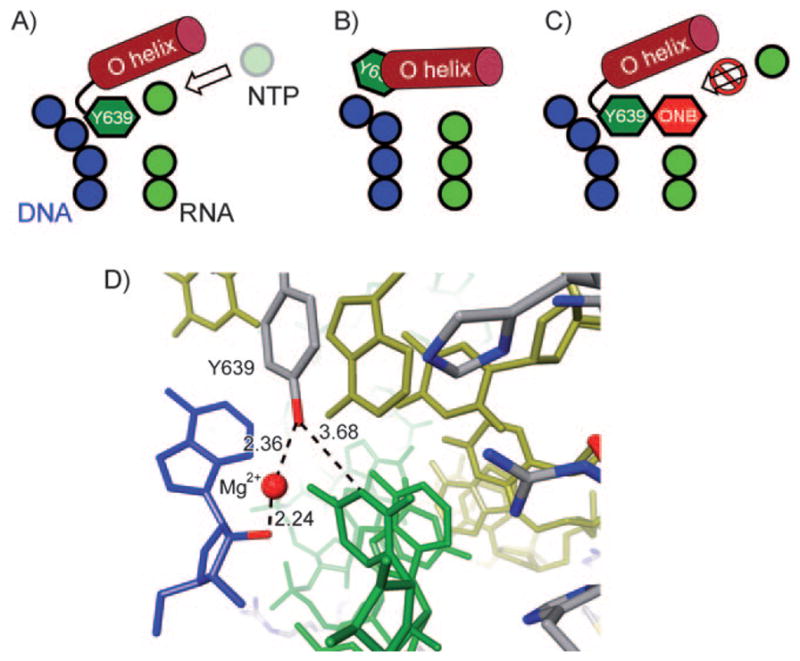
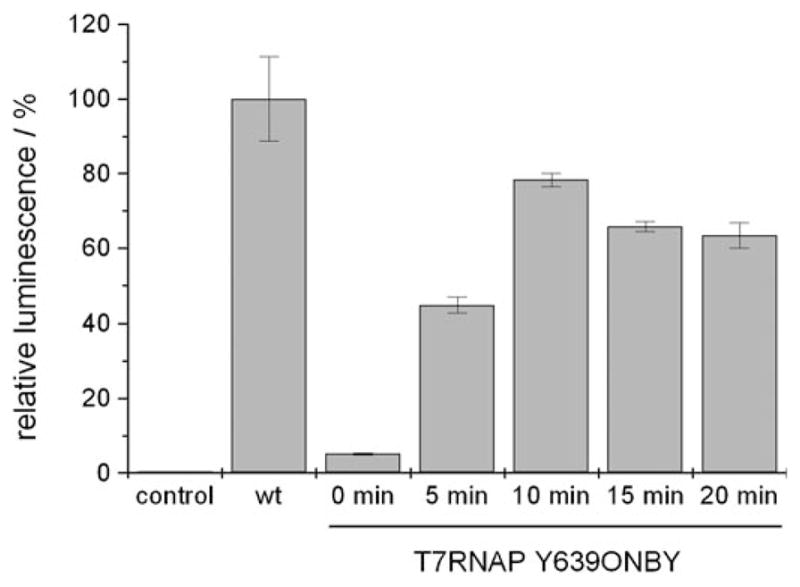
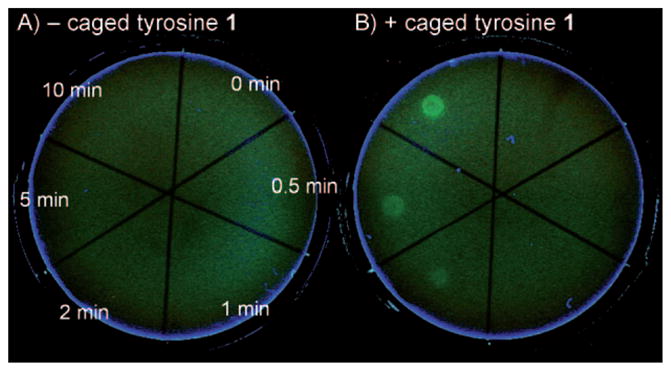
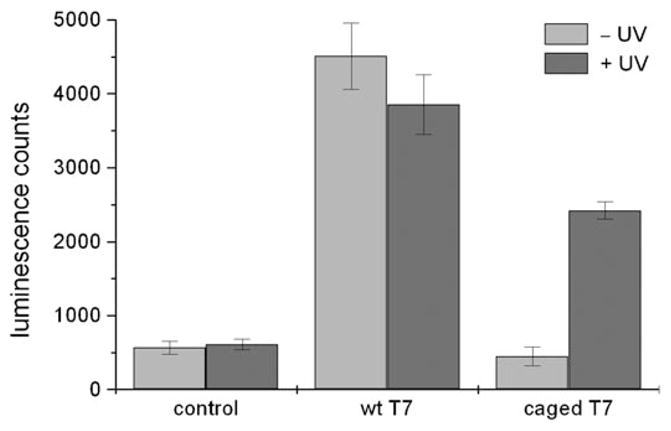
A light-activatable bacteriophage T7 RNA polymerase (T7RNAP) has been generated through the site-specific introduction of a photocaged tyrosine residue at the crucial position Tyr639 within the active site of the enzyme. The photocaged tyrosine disrupts polymerase activity by blocking the incoming nucleotide from reaching the active site of the enzyme. However, a brief irradiation with nonphototoxic UV light of 365 nm removes the ortho-nitrobenzyl caging group from Tyr639 and restores the RNA polymerase activity of T7RNAP. The complete orthogonality of T7RNAP to all endogenous RNA polymerases in pro- and eukaryotic systems allowed for the photochemical activation of gene expression in bacterial and mammalian cells. Specifically, E. coli cells were engineered to produce photocaged T7RNAP in the presence of a GFP reporter gene under the control of a T7 promoter. UV irradiation of these cells led to the spatiotemporal activation of GFP expression. In an analogous fashion, caged T7RNAP was transfected into human embryonic kidney (HEK293T) cells. Irradiation with UV light led to the activation of T7RNAP, thereby inducing RNA polymerization and expression of a luciferase reporter gene in tissue culture. The ability to achieve spatiotemporal regulation of orthogonal RNA synthesis enables the precise dissection and manipulation of a wide range of cellular events, including gene function.


Figures

Figure 1
Figure 1
Application of a caged, inactive T7RNAP in the photochemical regulation of orthogonal gene expression through UV irradiation.
Figure 2
Figure 2
A) Model of the T7RNAP polymerase open complex (preinsertion). B) Model of the RNA polymerase closed complex (insertion). C) Hypothesized model of the inactive caged RNA polymerase (ONB =ortho-nitrobenzyl). D) Crystal structure of the active site of T7RNAP, indicating the tyrosine Tyr639 and the central magnesium ion (PDB ID: 1S0V). The DNA template is shown in yellow, and the incoming nucleotide analogue diphosphomethyl-phosphonic acid adenosyl ester (APC) is shown in blue. Numbers indicate the length of dashed lines in Å.
Figure 3
Figure 3
Expression of photocaged T7RNAP Y639ONBY. Lane M: NEB broad-range protein marker. Lane 1: Ni-NTA purified expression from the pBH161-Y639TAG plasmid in the absence of 1. Lane 2: Ni-NTA purified expression in the presence of 1 (1 mM). Lane 3: Ni-NTA purified expression of wild-type T7RNAP from the pBH161. The yield of photocaged T7RNAP was 0.8 mg L−1 after Ni-NTA purification.
Figure 4
Figure 4
Light-activated in vitro transcription by the caged T7RNAP depending on the duration of irradiation. Caged T7RNAP (28 ng per 10 μL reaction volume) was irradiated on a UV transilluminator (25 W) at 365 nm for 0, 2, 5, 10 and 20 min. The transcription reaction was then started by adding a nucleotide substrate master mix (containing α-32P-ATP), and the reaction was stopped after 120 min by the addition of 2× RNA loading buffer containing urea. The samples were separated on a 10 % urea-polyacrylamide gel, and the gel was exposed to a phosphorimager cassette to be visualized by using a Storm 840 Phosphorimager, and the RNA product was quantified by using ImageQuant 5.2 software. The results were normalized to labeled RNA generated by wild-type T7RNAP at three concentrations (28, 14, and 9 ng per 10 μL reaction volume) All experiments were conducted in triplicate and normalized to wild-type T7RNAP (28 ng). The error bars represent standard deviations.
Figure 5
Figure 5
Light-activated in vitro transcription/translation of luciferase. Caged T7RNAP (70 ng per 25 μL reaction volume) was decaged on a transilluminator (25 W) at 365 nm for 0, 5, 10, 15 and 20 min. In vitro transcription/ translation reactions were initiated by adding wild-type and irradiated T7RNAP to a TNT-coupled rabbit reticulocyte system and plasmid pT7Luc (Promega). Luciferase activity was measured with a luciferase assay system on a VictorX5 luminescence plate reader (Perkin–Elmer). Control: no polymerase added. All experiments were conducted in triplicate and normalized to wild-type T7RNAP (70 ng). The error bars represent standard deviations.
Figure 6
Figure 6
In vivo spatiotemporal activation of transcription in E. coli cells. Bacteria were cotransformed with pSUPONBY and pBH161Y639TAG-T7GSTeGFP. Cells were grown in LB medium containing IPTG (0.1 mM), and without (A) or with (B) 1 (1 mM). Cultures were harvested at on OD600 of 0.6 by centrifugation and resuspended in LB medium containing 1 % low melt agarose. The suspension was transferred to a 35 mm plate and allowed to solidify. The plates were then segmented into 6 portions and each one of them received point UV irradiation of 365 nm for 0, 0.5, 1, 2, 5, and 10 min (in a clockwise fashion, UV LED fiber optics system, Prizmatix). The plates were then incubated at 37 °C for 16 h and placed in a 4 °C refrigerator for 24 h before imaging with a 365 nm excitation wavelength (Eagle Eye II, Stratagene).
Figure 7
Figure 7
In vivo light activation of T7RNAP-driven protein expression. HEK293T cells were cotransfected with pT7-IRES-Luc and no polymerase (control), wild-type T7RNAP, or caged T7RNAP. Cells were either kept in the dark (−UV) or irradiated for 2 min at 365 nm (+UV). Luciferase activity was measured after 24 h. All experiments were conducted in triplicate, and the error bars represent standard deviations.

Similar articles

Cited by

References

    1. Cramer P. BioEssays. 2002;24:724–729. - PubMed
    1. Deiters A. Chem Bio Chem. 2010;11:47–53. - PMC - PubMed
    2. Deiters A. Curr Opin Chem Biol. 2009;13:678–686. - PMC - PubMed
    3. Lee HM, Larson DR, Lawrence DS. ACS Chem Biol. 2009;4:409–427. - PMC - PubMed
    4. Casey JP, Blidner RA, Monroe WT. Mol Pharm. 2009;6:669–685. - PubMed
    5. Young DD, Deiters A. Org Biomol Chem. 2007;5:999–1005. - PubMed
    6. Tang X, Dmochowski IJ. Mol Biosyst. 2007;3:100–110. - PubMed
    7. Mayer G, Heckel A. Angew Chem. 2006;118:5020–5042.
    8. Angew Chem Int Ed. 2006;45:4900–4921. - PubMed
    1. Pelliccioli AP, Wirz J. Photochem Photobiol Sci. 2002;1:441–458. - PubMed
    2. Adams SR, Tsien RY. Annu Rev Physiol. 1993;55:755–784. - PubMed
    1. Young DD, Garner RA, Yoder JA, Deiters A. Chem Commun. 2009:568–570. - PMC - PubMed
    2. Young DD, Lusic H, Lively MO, Yoder JA, Deiters A. Chem Bio Chem. 2008;9:2937–2940. - PubMed
    3. Young DD, Deiters A. Angew Chem. 2007;119:4368–4370.
    4. Angew Chem Int Ed. 2007;46:4290–4292. - PubMed
    1. Edwards WF, Young DD, Deiters A. ACS Chem Biol. 2009;4:441–445. - PubMed

Publication types

LinkOut - more resources