. 2010 Mar 19:11:18.
doi: 10.1186/1471-2156-11-18.

Genetic evidence supports linguistic affinity of Mlabri--a hunter-gatherer group in Thailand

Collaborators, Affiliations

Genetic evidence supports linguistic affinity of Mlabri--a hunter-gatherer group in Thailand

Shuhua Xu et al. BMC Genet. .

Abstract

Background: The Mlabri are a group of nomadic hunter-gatherers inhabiting the rural highlands of Thailand. Little is known about the origins of the Mlabri and linguistic evidence suggests that the present-day Mlabri language most likely arose from Tin, a Khmuic language in the Austro-Asiatic language family. This study aims to examine whether the genetic affinity of the Mlabri is consistent with this linguistic relationship, and to further explore the origins of this enigmatic population.

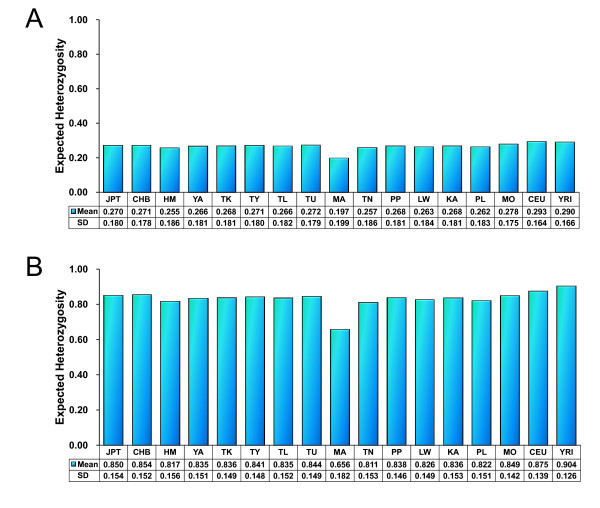
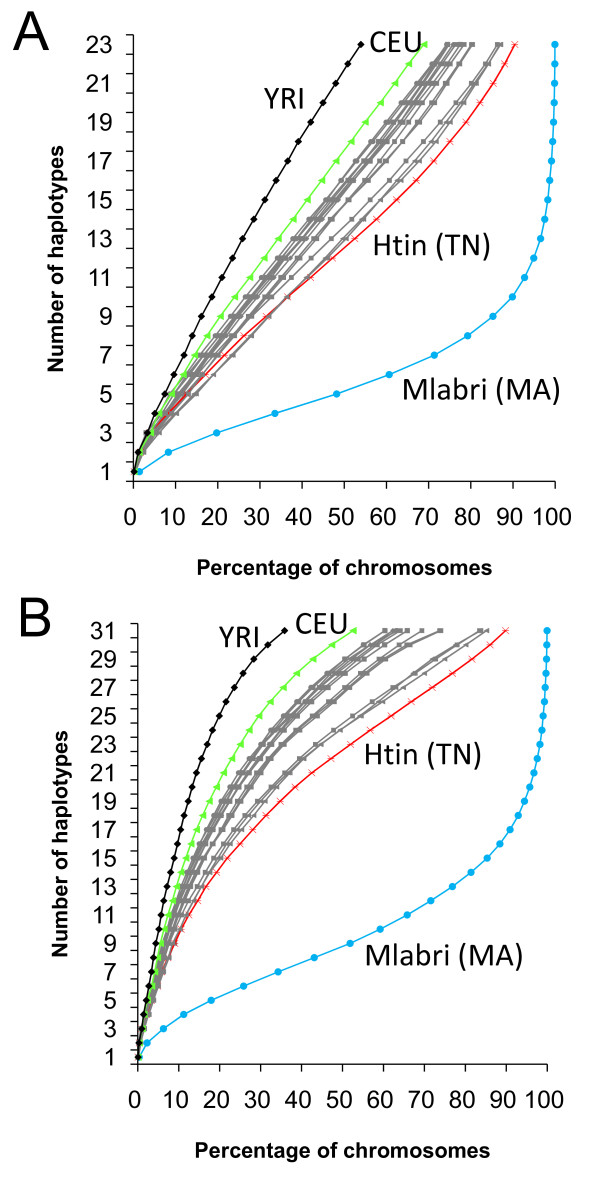
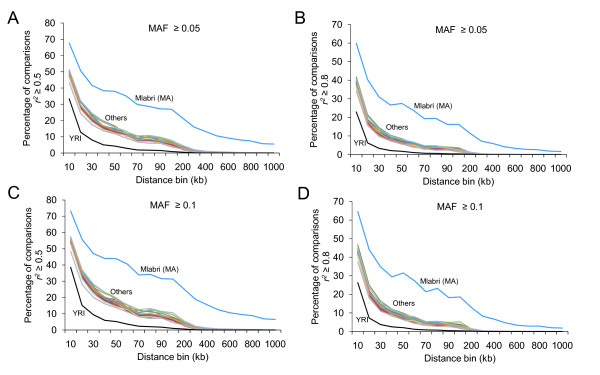
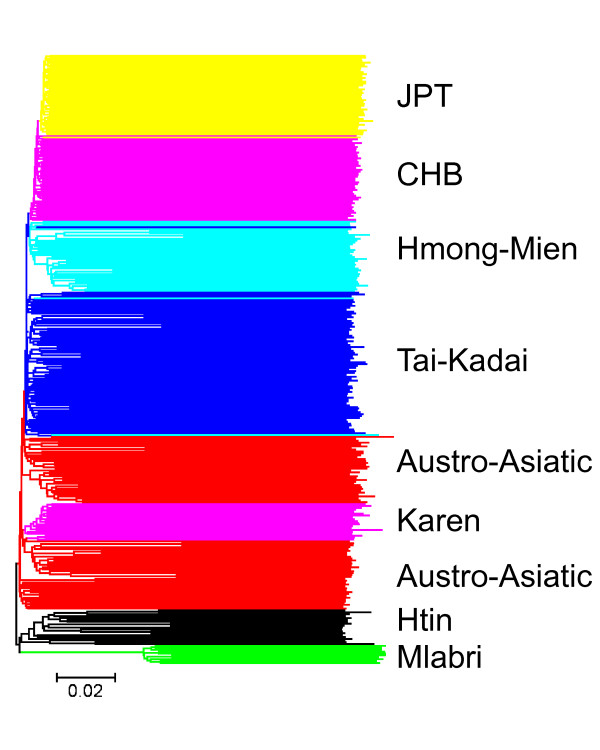
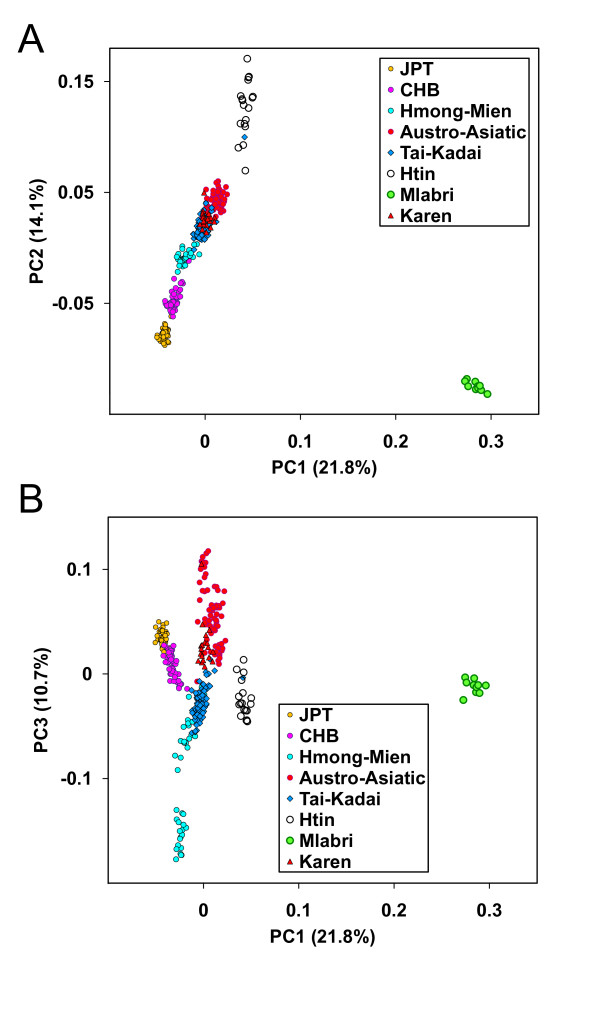
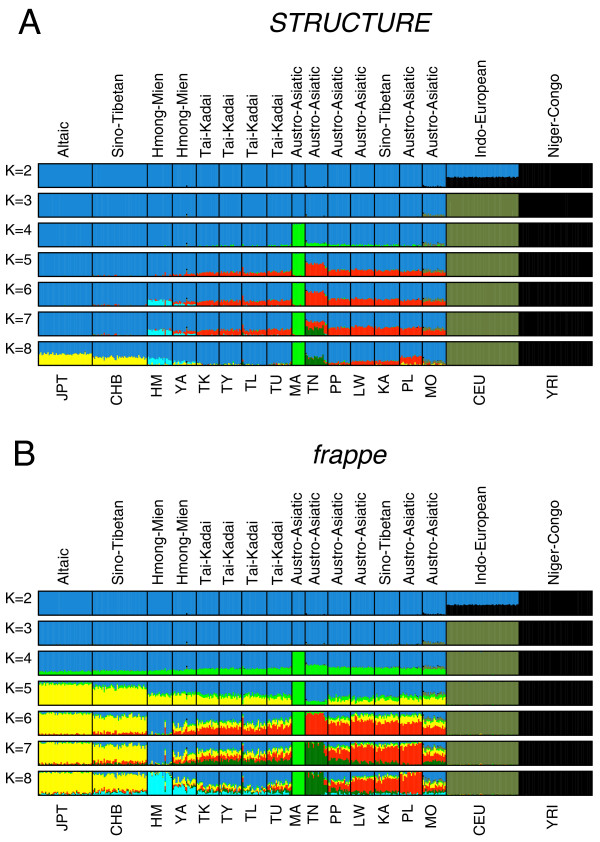
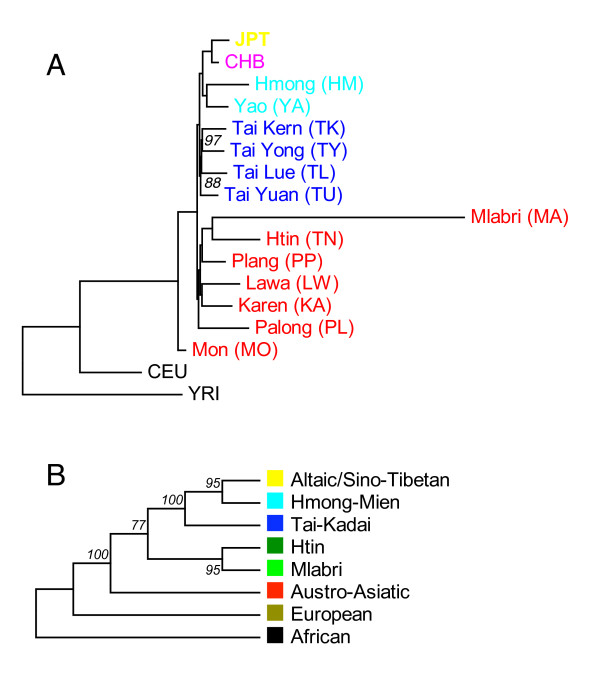
Results: We conducted a genome-wide analysis of genetic variation using more than fifty thousand single nucleotide polymorphisms (SNPs) typed in thirteen population samples from Thailand, including the Mlabri, Htin and neighboring populations of the Northern Highlands, speaking Austro-Asiatic, Tai-Kadai and Hmong-Mien languages. The Mlabri population showed higher LD and lower haplotype diversity when compared with its neighboring populations. Both model-free and Bayesian model-based clustering analyses indicated a close genetic relationship between the Mlabri and the Htin, a group speaking a Tin language.

Conclusion: Our results strongly suggested that the Mlabri share more recent common ancestry with the Htin. We thus provided, to our knowledge, the first genetic evidence that supports the linguistic affinity of Mlabri, and this association between linguistic and genetic classifications could reflect the same past population processes.


Figures

Figure 1
Figure 1
Heterozygosity in 17 populations. In table at the bottom of each plot displayed the average and the standard deviation of He in each population sample. The sample information of each population is shown in Table 1. A: He were calculated from 55,561 SNPs shared by 17 populations. SD denotes standard deviation of the He values across 55,561 SNPs. B: He were calculated from haplotypes of 500 kb windows, SD denotes standard deviation of the He values across windows.
Figure 2
Figure 2
Number of haplotypes and their cumulative proportion. (A) The number of haplotypes and their cumulative proportion in the genome for 500-Kb sliding windows. (B) The number of haplotypes and their cumulative proportion in the genome for 1-Mb sliding windows.
Figure 3
Figure 3
Decay of linkage disequilibrium (LD) over distance. LD was measured by pairwise comparison (A&C, r2 ≥ 0.5; B&D, r2 ≥ 0.8) between markers that had minor allele frequency ≥ 0.05 (A, B), ≥ 0.1 (C, D) and that fell into the same intermarker distance bin. Blue lines denote Mlabri, black lines denote YRI, others include the rest 15 population samples.
Figure 4
Figure 4
Relationships among 446 individuals reconstructed using Neighbor-Joining method on a matrix of allele sharing distances (ASDs). Pairwise ASD was calculated using 55,561 autosomal SNPs. Individuals are shaded by different colors according to their ethnic or linguistic affiliations.
Figure 5
Figure 5
Plot of Principal Components for 446 individuals representing 15 populations. Individuals are shaded by different colors according to their predefined population affiliations, and the legend is displayed on the lower right of the plot. A: plot of the first two principle components. B: plot of the first and the third principle components.
Figure 6
Figure 6
Estimated population structure. Each colored vertical line represents an individual that is assigned proportionally to one of the K clusters with the proportions represented by the relative lengths of the K different colors. Black lines separate individuals of different populations. Populations are labeled below the figure with the same convention shown in Table 1 and Figure 1. Left plot: population structure inferred by STRUCTURE; right plot: population structure inferred by frappe. For both STRUCTURE and frappe results, the figure shown for a given K is based on the highest probability run of ten runs at that K.
Figure 7
Figure 7
Maximum likelihood tree of populations and components. A: Maximum likelihood tree of 17 populations, bootstrap values obtained by sampling 55,561 SNPs 100 times with replacements, only values less than 100 are shown. Colored population names (IDs) help recognize their linguistic affinities, yellow: Altaic, magenta: Sino-Tibetan, light-blue: Tai-Kadai, red: Austro-Asiatic. B: Maximum likelihood tree of components inferred from STRUCTURE analysis (K = 8) Bootstrap values for B was obtained by randomly sampling cluster frequencies 100 times from STRUCTURE results.

References

    1. Pookajorn S. The Phi Tong Luang (Mlabri): A hunter-gatherer group in Thailand. Bangkok: Odeon Store Printing House; 1992.
    1. Rischel J. Minor Mlabri, a hunter-gatherer language of northern Indochina. Copenhagen: Museum Tusculanum; 1995. - PubMed
    1. Schliesinger J. Ethnic Groups of Laos. Vol. 2. Bangkok: White Lotus Press; 2003.
    1. Wikipedia_contributors. 'Mlabri people', Wikipedia, The Free Encyclopedia. 2009. http://en.wikipedia.org/wiki/Mlabri_people
    1. Wikipedia_contributors. 'Mlabri language', Wikipedia, The Free Encyclopedia. 2009. http://en.wikipedia.org/wiki/Mlabri_language

Publication types

LinkOut - more resources