. 2010 Apr 9;86(4):526-39.
doi: 10.1016/j.ajhg.2010.02.021. Epub 2010 Mar 18.

High-resolution detection of identity by descent in unrelated individuals

Affiliations

High-resolution detection of identity by descent in unrelated individuals

Sharon R Browning et al. Am J Hum Genet. .

Abstract

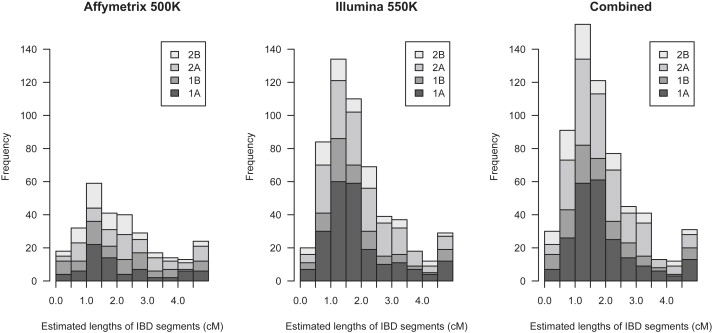
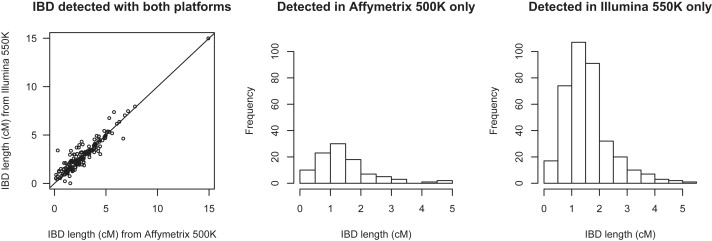
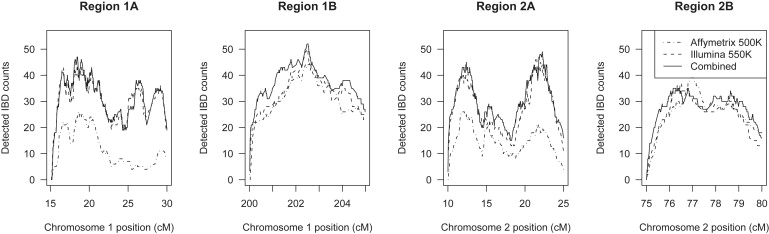
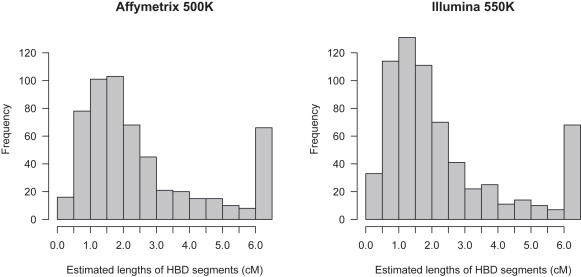
Detection of recent identity by descent (IBD) in population samples is important for population-based linkage mapping and for highly accurate genotype imputation and haplotype-phase inference. We present a method for detection of recent IBD in population samples. Our method accounts for linkage disequilibrium between SNPs to enable full use of high-density SNP data. We find that our method can detect segments of a length of 2 cM with moderate power and negligible false discovery rate in Illumina 550K data in Northwestern Europeans. We compare our method with GERMLINE and PLINK, and we show that our method has a level of resolution that is significantly better than these existing methods, thus extending the usefulness of recent IBD in analysis of high-density SNP data. We survey four genomic regions in a sample of UK individuals of European descent and find that on average, at a given location, our method detects IBD in 2.7 per 10,000 pairs of individuals in Illumina 550K data. We also present methodology and results for detection of homozygosity by descent (HBD) and survey the whole genome in a sample of 1373 UK individuals of European descent. We detect HBD in 4.7 individuals per 10,000 on average at a given location. Our methodology is implemented in the freely available BEAGLE software package.


Figures

Figure 1
Figure 1
Example of an LD Model on Four SNPs SNP 1 is represented by edges eA and eB; SNP 2 by edges eC, eD, eE; SNP 3 by edges eF, eG, eH; and SNP 4 by edges eI, eJ, eK, eL. For each SNP, allele 1 is represented by a solid line, whereas allele 2 is represented by a dashed line. Haplotype H1 (1 1 1 1) follows the orange path (eA, eC, eF, eI), and haplotye H2 (2 1 1 1) follows the blue path (eB, eE, eF, eI).
Figure 2
Figure 2
Power to Detect IBD with BEAGLE Four sizes of IBD segments are considered, and these are labeled at the top of the plot. Four different regions of the genome are interrogated, and these are labeled at the bottom of the plot. Two SNP arrays plus their union (“Combined”) are considered for each segment size and region. Each bar is the proportion detected out of 30 artificial IBD segments.
Figure 3
Figure 3
Power to Detect HBD with BEAGLE Four sizes of HBD segments are considered, and these are labeled at the top of the plot. Four different regions of the genome are interrogated, and these are labeled at the bottom of the plot. Two SNP arrays plus their union (“Combined”) are considered for each segment size and region. Each bar is the proportion detected out of 60 artificial HBD segments.
Figure 4
Figure 4
Under- and Overestimation of IBD Segments Detected in Illumina 550K Data with BEAGLE For detected IBD segments of given size (x axis), the left plot shows the amount of the IBD segment with posterior IBD probability < 0.5, whereas the right plot shows the distance over which the posterior IBD probability remained > 0.5 beyond the boundaries of the IBD segment. The plots are box plots: the thick black line gives the median, the box gives the upper and lower quartiles, the “whiskers” extend to the furthest data point that is no more than 1.5 times the interquartile range from the box, and outlying points beyond the whiskers are individually plotted.
Figure 5
Figure 5
Estimated Lengths of IBD Segments Detected in 58BC Data with BEAGLE The rightmost bar in each plot includes all estimated segment lengths > 4.5 cM. IBD segments were detected in the four regions described in Table 1. The left panel shows lengths of segments detected with the use of Affymetrix 500K data, the center panel shows lengths of segments detected with Illumina 550K data, and the right panel shows lengths of segments detected with the union of the two SNP chips. A total of 100,000 randomly selected pairs of individuals were analyzed.
Figure 6
Figure 6
Comparison of Lengths of IBD Segments Detected with BEAGLE with Data from Both Platforms or with Data from One Platform Only The results are based on IBD detected in 100,000 random pairs of individuals from the 58BC data in four regions (see Table 1). The left panel shows detected lengths on both platforms of IBD segments detected with the use of both the Affymetrix 500K and the Illumina 550K data (there are 188 such segments). The center and right panels show distributions of detected lengths of IBD segments found with the use of Affymetrix 500K data but not with Illumina 550K data (center panel; 99 segments) or with Illumina 550K data but not with Affymetrix 500K data (right panel; 364 segments).
Figure 7
Figure 7
Total IBD Detected with BEAGLE across Each of the Four Regions A total of 100,000 pairs of individuals were tested.
Figure 8
Figure 8
Estimated Lengths of HBD Segments Detected in 58BC Data with BEAGLE The rightmost bar in each plot includes all estimated segment lengths > 6 cM. The left panel shows lengths of segments detected with the use of Affymetrix 500K data, whereas the right panel shows lengths of segments detected with Illumina 550K data. The data are from 1373 individuals with genotypes on both platforms.
Figure 9
Figure 9
Genomic HBD Probabilities from BEAGLE for Five Individuals with the Highest Genomic Levels of HBD Individual (A) has 7.1% of autosomal SNPs with P(HBD) > 0.5, (B) has 3.2%, (C) has 3.6%, (D) has 6.4%, (E) has 3.5%. Results are from data on the Illumina 550K platform. The dotted vertical lines are the chromosome boundaries.

References

    1. Browning S.R. Estimation of pairwise identity by descent from dense genetic marker data in a population sample of haplotypes. Genetics. 2008;178:2123–2132. - PMC - PubMed
    1. Purcell S., Neale B., Todd-Brown K., Thomas L., Ferreira M.A., Bender D., Maller J., Sklar P., de Bakker P.I., Daly M.J., Sham P.C. PLINK: a tool set for whole-genome association and population-based linkage analyses. Am. J. Hum. Genet. 2007;81:559–575. - PMC - PubMed
    1. Nelson, S., Merriman, B., Chen, Z., Ogdie, M., Stone, J., and Strom, S. (2006). Applications of Pedigree-Free Identity-By-Descent Mapping to Localizing Disease Genes [abstract 1530]. Presented at the annual meeting of The American Society of Human Genetics, October 11, 2006, New Orleans, LA, USA. Available from http://www.ashg.org/genetics/ashg06s/.
    1. Albrechtsen A., Sand Korneliussen T., Moltke I., van Overseem Hansen T., Nielsen F.C., Nielsen R. Relatedness mapping and tracts of relatedness for genome-wide data in the presence of linkage disequilibrium. Genet. Epidemiol. 2009;33:266–274. - PubMed
    1. Wijsman E.M., Amos C.I. Genetic analysis of simulated oligogenic traits in nuclear and extended pedigrees: summary of GAW10 contributions. Genet. Epidemiol. 1997;14:719–735. - PubMed

Publication types

LinkOut - more resources