

Widespread effects of nicotinic acid on gene expression in insulin-sensitive tissues: implications for unwanted effects of nicotinic acid treatment
- PMID: 20303128
- PMCID: PMC2912158
- DOI: 10.1016/j.metabol.2010.02.013
Widespread effects of nicotinic acid on gene expression in insulin-sensitive tissues: implications for unwanted effects of nicotinic acid treatment
Abstract
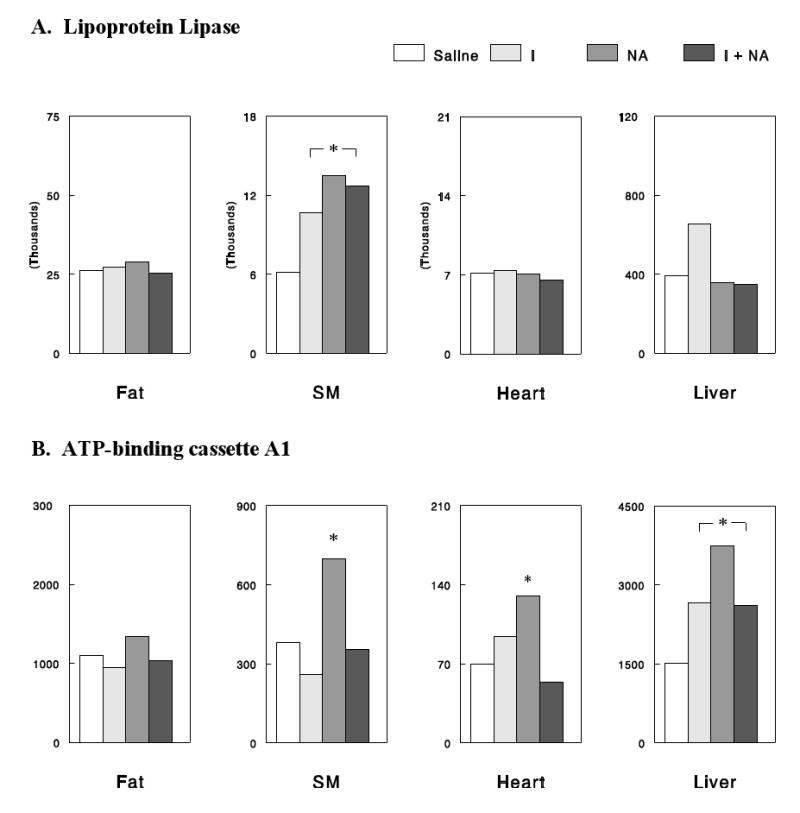
Nicotinic acid (NA; or niacin) has been used as a hypolipidemic agent for more than 4 decades. However, the mechanisms underlying the effects of NA treatment (wanted and unwanted) are still poorly understood. In the present study, we discovered that NA infusion in rats resulted in dephosphorylation (ie, activation) of the forkhead transcription factor FOXO1 in insulin-sensitive tissues such as skeletal and cardiac muscles, liver, and adipose tissue. These NA effects were opposite to the effects of insulin to increase FOXO1 phosphorylation. To test whether NA alters gene expression in these tissues, rats were infused for 7 hours with NA (30 μmol/h) and/or insulin (5 mU/[kg min]); and gene expression was evaluated using a microarray analysis. Nicotinic acid had widespread effects on gene expression in all of the tissues studied, and the number of genes affected by NA greatly exceeded that of genes affected by insulin. A systematic (or strategic) analysis of the microarray data revealed that there were numerous genes whose expression was regulated inversely by insulin and NA in correlation with FOXO1 phosphorylation, representing potential FOXO1 target genes. We also identified a group of genes whose expression was altered by NA exclusively in adipose tissue, presumably because of stimulation of the NA receptor in this tissue. Finally, there were genes whose expression was altered by both NA and insulin, likely via lowering plasma free fatty acid levels, including lipoprotein lipase and adenosine triphosphate-binding cassette A1, which play a major role in the regulation of circulating lipids. Thus, our data suggest that NA alters gene expression in insulin-sensitive tissues by various mechanisms. Some of the NA-induced changes in gene expression are discussed as potential mechanisms underlying wanted and unwanted effects of NA treatment.
Copyright © 2011 Elsevier Inc. All rights reserved.
Conflict of interest statement
We have no conflicts of interest to disclose in connection with the manuscript.
Figures

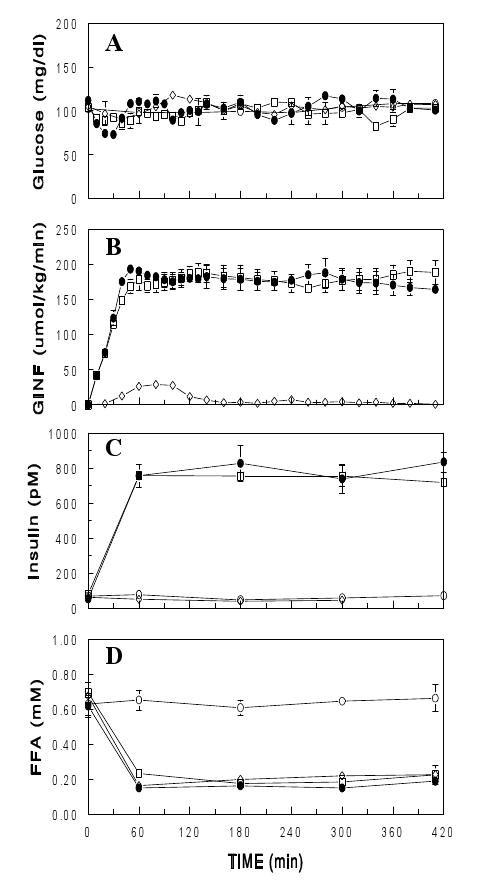
 ), NA (30 μmol/h; ▯), insulin (5 mU/kg/min;
  ), or both NA and insulin ( ) for 7 h in conscious rats. Data are means± SEM (n=3 for each group).
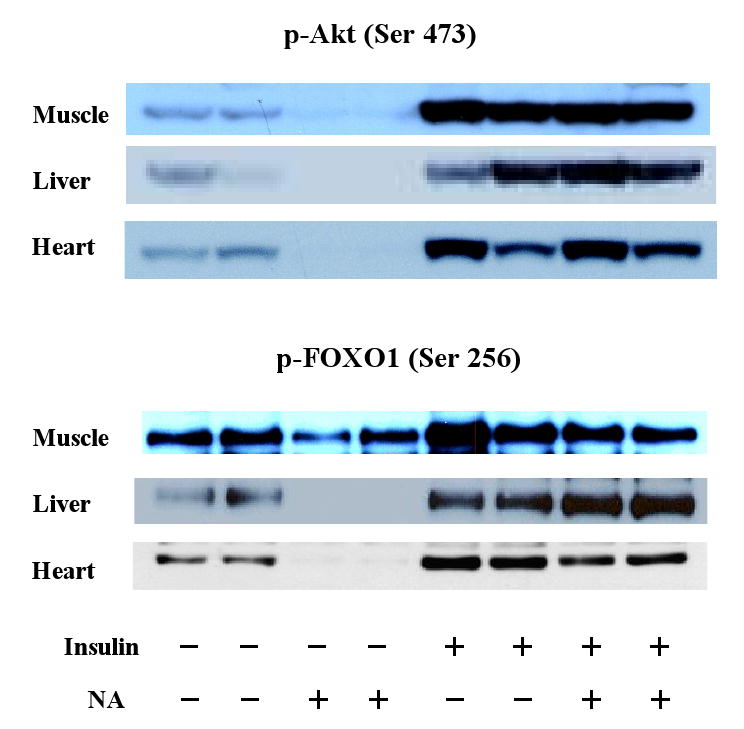


Similar articles
-
Continuous 24-h nicotinic acid infusion in rats causes FFA rebound and insulin resistance by altering gene expression and basal lipolysis in adipose tissue.Am J Physiol Endocrinol Metab. 2011 Jun;300(6):E1012-21. doi: 10.1152/ajpendo.00650.2010. Epub 2011 Mar 8. Am J Physiol Endocrinol Metab. 2011. PMID: 21386057 Free PMC article.
-
Effects of nicotinic acid on gene expression: potential mechanisms and implications for wanted and unwanted effects of the lipid-lowering drug.J Clin Endocrinol Metab. 2011 Oct;96(10):3048-55. doi: 10.1210/jc.2011-1104. Epub 2011 Aug 3. J Clin Endocrinol Metab. 2011. PMID: 21816780 Free PMC article. Review.
-
Insulin regulation of skeletal muscle PDK4 mRNA expression is impaired in acute insulin-resistant states.Diabetes. 2006 Aug;55(8):2311-7. doi: 10.2337/db05-1606. Diabetes. 2006. PMID: 16873695
-
A potential role for Akt/FOXO signalling in both protein loss and the impairment of muscle carbohydrate oxidation during sepsis in rodent skeletal muscle.J Physiol. 2008 Nov 15;586(22):5589-600. doi: 10.1113/jphysiol.2008.160150. Epub 2008 Sep 25. J Physiol. 2008. PMID: 18818241 Free PMC article.
-
The role of FOXO in the regulation of metabolism.Curr Diab Rep. 2009 Jun;9(3):208-14. doi: 10.1007/s11892-009-0034-5. Curr Diab Rep. 2009. PMID: 19490822 Review.
Cited by
-
Associations between Forkhead Box O1 (FoxO1) Expression and Indicators of Hepatic Glucose Production in Transition Dairy Cows Supplemented with Dietary Nicotinic Acid.PLoS One. 2016 Jan 22;11(1):e0146670. doi: 10.1371/journal.pone.0146670. eCollection 2016. PLoS One. 2016. PMID: 26800252 Free PMC article.
-
Association of dietary niacin intake with all-cause and cardiovascular mortality: National Health and Nutrition Examination Survey (NHANES) 2003-2018.Sci Rep. 2024 Nov 16;14(1):28313. doi: 10.1038/s41598-024-79986-9. Sci Rep. 2024. PMID: 39550522 Free PMC article.
-
Potential effects of the combination of nicotinamide, vitamin B2 and vitamin C on oxidative-mediated hepatotoxicity induced by thioacetamide.Lipids Health Dis. 2018 Feb 14;17(1):29. doi: 10.1186/s12944-018-0674-z. Lipids Health Dis. 2018. PMID: 29444683 Free PMC article.
-
Long-term niacin treatment induces insulin resistance and adrenergic responsiveness in adipocytes by adaptive downregulation of phosphodiesterase 3B.Am J Physiol Endocrinol Metab. 2014 Apr 1;306(7):E808-13. doi: 10.1152/ajpendo.00641.2013. Epub 2014 Jan 28. Am J Physiol Endocrinol Metab. 2014. PMID: 24473440 Free PMC article.
-
A Fall in plasma free fatty acid (FFA) level activates the hypothalamic-pituitary-adrenal axis independent of plasma glucose: evidence for brain sensing of circulating FFA.Endocrinology. 2012 Aug;153(8):3587-92. doi: 10.1210/en.2012-1330. Epub 2012 Jun 5. Endocrinology. 2012. PMID: 22669895 Free PMC article.
References
-
- Karpe F, Frayn KN. The nicotinic acid receptor--a new mechanism for an old drug. Lancet. 2004;363:1892–1894. - PubMed
-
- Walldius G, Wahlberg G. Effects of nicotinic acid and its derivatives on lipid metabolism and other metabolic factors related to atherosclerosis. Adv Exp Med Biol. 1985;183:281–293. - PubMed
-
- Drood JM, Zimetbaum PJ, Frishman WH. Nicotinic acid for the treatment of hyperlipoproteinemia. J Clin Pharmacol. 1991;31:641–650. - PubMed
-
- Carlson LA, Oro L. The effect of nicotinic acid on the plasma free fatty acid; demonstration of a metabolic type of sympathicolysis. Acta Med Scand. 1962;172:641–645. - PubMed
Publication types
MeSH terms
Substances
Grants and funding
LinkOut - more resources
Full Text Sources
Medical
Research Materials
Miscellaneous
