. 2010 May;71(7):716-25.
doi: 10.1016/j.phytochem.2010.02.006. Epub 2010 Mar 18.

Identification of JAK-STAT pathways as important for the anti-inflammatory activity of a Hypericum perforatum fraction and bioactive constituents in RAW 264.7 mouse macrophages

Affiliations

Identification of JAK-STAT pathways as important for the anti-inflammatory activity of a Hypericum perforatum fraction and bioactive constituents in RAW 264.7 mouse macrophages

Kimberly D P Hammer et al. Phytochemistry. 2010 May.

Abstract

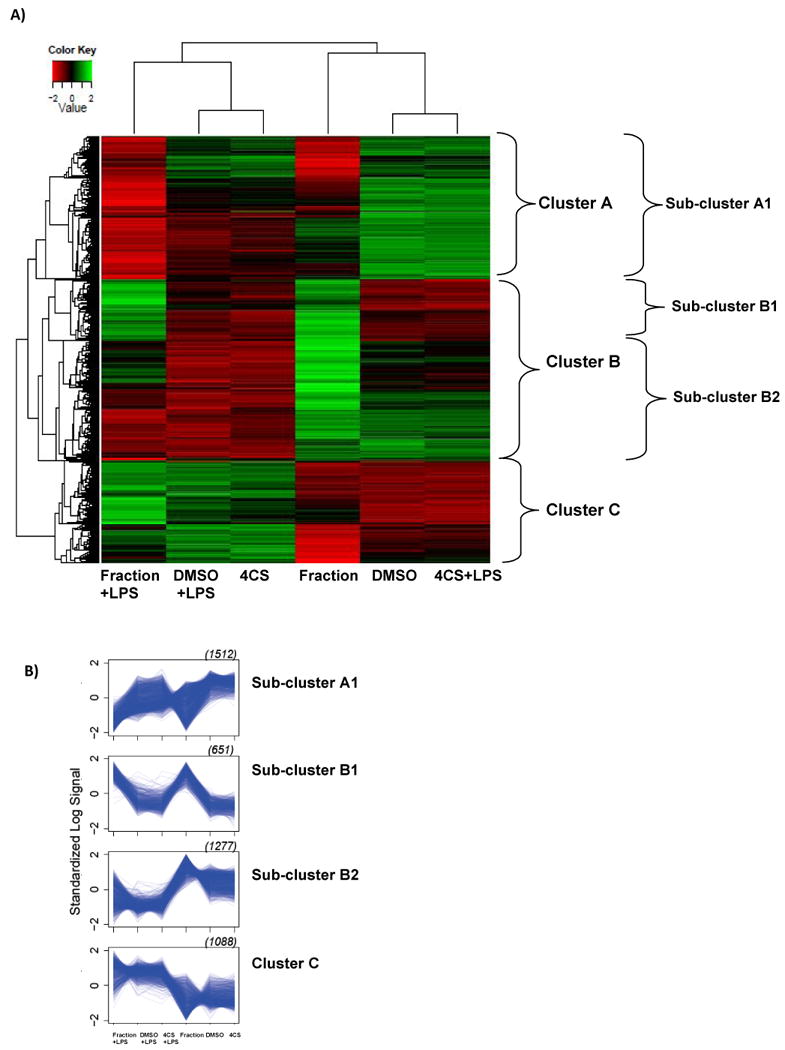
Hypericum perforatum extracts have been used to treat diseases, including mild-to-moderate depression and inflammatory conditions. It is particularly important to identify which constituents present in the H. perforatum extracts are responsible for its anti-inflammatory activity since consumers are taking H. perforatum preparations to treat inflammation. We used a combination of four putative bioactive constituents, called the 4-component-system that interacted synergistically to explain the light-activated anti-inflammatory activity of an H. perforatum fraction in RAW 264.7 mouse macrophages. We also combined the constituents at concentrations detected in the fraction to identify key molecular targets. LPS was used to model an inflammatory response, and the 4-component-system and H. perforatum fraction were used as treatments that inhibited LPS-induced prostaglandin E(2) (PGE(2)) production in RAW 264.7 mouse macrophages in the studies of gene expression profiles. We used Affymetrix genechips, statistical analysis, and quantitative real-time PCR to identify key gene targets of the 4-component-system and the sub-fraction from an H. perforatum ethanol extract. The H. perforatum sub-fraction, with or without LPS stimulation, affected far more genes than the 4-component-system with and without LPS. Genes involved in Janus kinase, as well as a signal transducer and activator of transcription (JAK-STAT) and eicosanoid pathways were identified that could account for the reduction in PGE(2) observed with both treatments in LPS-stimulated macrophages. Ten genes may be particularly important targets for activity of the 4-component-system and the fraction with LPS stimulation and these genes were involved in inflammatory signaling pathways, namely the JAK-STAT and eicosanoid pathways.


Figures

Figure 1
Figure 1
Diagram highlighting the number and intersection of differentially expressed genes for fraction and 4-component-system compared against media +DMSO and fraction +LPS and 4-component-system +LPS compared against media +LPS +DMSO. FDR < 5% for fraction and fraction +LPS or FDR < 40% for 4-component-system and 4-component-system +LPS, all treatments with p-value < 0.05. Numbers in common represent genes that were differentially expressed under each respective treatment group when compared to respective control. a2 of the 3 genes that were differentially expressed by both fraction and 4-component-system when compared against media +DMSO were also differentially expressed by 4-component-system +LPS when compared against media +LPS +DMSO. b32 of the 44 genes that were differentially expressed by fraction +LPS and 4-component-system +LPS when compared against media +LPS +DMSO were also differentially expressed by fraction when compared to media +DMSO (as shown in Figure 2).
Figure 2
Figure 2
Heat map showing the magnitude of overlapping differential expression of the genes impacted by treatments. Cluster and TreeView programs were used to create the heat map. Black represents no change, red represents an increase as compared to respective control, and green represents a decrease as compared to respective control. 4 Comp Sys= 4-component-system. a Fraction and 4-component-system compared to media + DMSO as in Figure 2. b Fraction + LPS and 4-component-system + LPS compared to media + LPS + DMSO as in Figure 1. c 40% FDR for 4-component-system with and without LPS. d 5% FDR for fraction and fraction +LPS. *indicates 12 genes that were significantly affected by fraction +LPS and 4-component-system +LPS when compared to media +LPS +DMSO but not fraction when compared to media +DMSO
Figure 3
Figure 3
A) Hierarchical cluster analysis of differentially expressed genes in RAW 264.7 macrophages treated with or without LPS and with either an H. perforatum sub-fraction or 4-component-system. 4,536 differentially expressed genes were determined as described in the Methods section. The heatmap is arranged with genes as rows and treatments as columns. Green represents above average expression levels and red represents below average expression levels. Based on the largest average silhouette width, three main clusters were determined with 7 sub-clusters: cluster A with 1,517 genes (sub-clusters A1 with 1,523 genes, A2 with 2 genes, A3 with 3 genes), cluster B with 1,931 genes (sub-clusters B1 with 651 genes, B2 with 1,277 genes, B3 with 3 genes), and cluster C with 1,088 genes (could not be broken down into sub-clusters based on the analysis). All 3 clusters are shown on figure 3A and 4 of the 7 sub-clusters (A1, B1, B2, cluster C) are also shown. Sub-clusters A2, A3, and B3 are not shown due to small size (2, 3, and 3 genes, respectively) but were embedded in their respective clusters (A, A, and B) on the heat map. B) Standardized log signal for 4 of the 7 sub-clusters identified in the analysis represents changes in expression level with different treatment groups. The size of each cluster is given in parentheses on the right above the sub-cluster graph; three other sub-clusters A2, A3, and B3 with sizes of 2, 3, and 3 respectively are not presented. 4CS= 4-component-system, DMSO= media +DMSO control.
Figure 4
Figure 4
Time-course gene expression analysis (0.5, 1, 2, 4, 8, and 24 hours after treatment) using real-time quantitative PCR of genes involved in inflammation. Data represented as change in expression level of transcript abundance compared to media control at time point 0. Media +LPS +DMSO treatment time-points that do not share common italicized letters are significantly different with a <b <c (p-value <0.05) as compared to time point 0 media control expression level of the respective gene. * Data with an asterisk indicates that the gene expression level for the treatment (fraction +LPS or 4-component-system +LPS) was significantly different than media +LPS +DMSO control for the respective time-point with a p-value <0.05. N=3 for each.

References

    1. Benjamini Y, Hochberg Y. Controlling the false discovery rate: a practical and powerful approach to multiple testing. Journal of the Royal Statistical Society: Series B. 1995;57:289–300.
    1. Bilia AR, Gallori S, Vincieri FF. St. John's wort and depression: Efficacy, safety and tolerability-an update. Life Sciences. 2002;70:3077–3096. - PubMed
    1. Bjorkbacka H, Fitzgerald KA, Huet F, Li X, Gregory JA, Lee MA, Ordija CM, Dowley NE, Golenbock DT, Freeman MW. The induction of macrophage gene expression by LPS predominantly utilizes MyD88-independent signaling cascades. Physiological Genomics. 2004;19:319–330. - PubMed
    1. Butterweck V, Lieflander-Wulf U, Winterhoff H, Nahrstedt A. Plasma levels of hypericin in presence of procyanidin B2 hyperoside: a pharmacokinetic study in rats. Planta Med. 2003;69:189–192. - PubMed
    1. Coussens LM, Werb Z. Inflammation and cancer. Nature. 2002;420:860–867. - PMC - PubMed

Publication types