

Two populations of neurokinin 1 receptor-expressing projection neurons in lamina I of the rat spinal cord that differ in AMPA receptor subunit composition and density of excitatory synaptic input
- PMID: 20303396
- PMCID: PMC3169794
- DOI: 10.1016/j.neuroscience.2010.03.028
Two populations of neurokinin 1 receptor-expressing projection neurons in lamina I of the rat spinal cord that differ in AMPA receptor subunit composition and density of excitatory synaptic input
Abstract
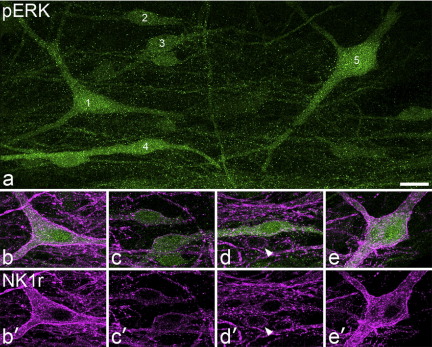
Lamina I of the spinal cord contains many projection neurons that express the neurokinin 1 receptor (NK1r). It has been reported that these cells can undergo long-term potentiation (LTP), which may result from insertion of AMPA-type glutamate receptors (AMPArs) containing GluA1 or GluA4 subunits. We therefore investigated synaptic AMPAr expression on these cells with immunocytochemistry following antigen-retrieval. We also examined their density of glutamatergic input (by analysing AMPAr synaptic puncta and contacts from glutamatergic boutons), and phosphorylation of extracellular signal-regulated kinases (pERKs) following noxious stimulation. Our results indicate that there are two populations of NK1r-expressing projection neurons: large GluA4(+)/GluA1(-) cells with a high density of glutamatergic input and small GluA1(+)/GluA4(-) cells with a much lower input density. Results from pERK experiments suggested that the two groups may not differ in the types of noxious stimulus that activate them. Glutamatergic synapses on distal dendrites of the large cells were significantly longer than those on proximal dendrites, which presumably compensates for the greater attenuation of distally-generated excitatory postsynaptic currents (EPSCs). Both types of cell received contacts from peptidergic primary afferents, however, on the large cells these appeared to constitute over half of the glutamatergic synapses, and were often associated with elongated AMPAr puncta. This suggests that these afferents, which probably contain substance P, provide a powerful, secure synaptic input to large NK1r-expressing projection neurons. These results demonstrate the importance of GluA4-containing AMPArs in nociceptive transmission and raise the possibility that different forms of LTP in lamina I projection neurons may be related to differential expression of GluA1/GluA4.
Copyright 2010 IBRO. Published by Elsevier Ltd. All rights reserved.
Figures


Similar articles
-
Large projection neurons in lamina I of the rat spinal cord that lack the neurokinin 1 receptor are densely innervated by VGLUT2-containing axons and possess GluR4-containing AMPA receptors.J Neurosci. 2008 Dec 3;28(49):13150-60. doi: 10.1523/JNEUROSCI.4053-08.2008. J Neurosci. 2008. PMID: 19052206 Free PMC article.
-
Neurokinin 1 receptor-expressing projection neurons in laminae III and IV of the rat spinal cord have synaptic AMPA receptors that contain GluR2, GluR3 and GluR4 subunits.Eur J Neurosci. 2009 Feb;29(4):718-26. doi: 10.1111/j.1460-9568.2009.06633.x. Epub 2009 Feb 6. Eur J Neurosci. 2009. PMID: 19200070 Free PMC article.
-
Projection neurons in lamina III of the rat spinal cord are selectively innervated by local dynorphin-containing excitatory neurons.J Neurosci. 2012 Aug 22;32(34):11854-63. doi: 10.1523/JNEUROSCI.2707-12.2012. J Neurosci. 2012. PMID: 22915126 Free PMC article.
-
Molecular determinants of AMPA receptor subunit assembly.Trends Neurosci. 2007 Aug;30(8):407-16. doi: 10.1016/j.tins.2007.06.005. Epub 2007 Jul 16. Trends Neurosci. 2007. PMID: 17629578 Review.
-
Spinal AMPA receptors: Amenable players in central sensitization for chronic pain therapy?Channels (Austin). 2021 Dec;15(1):284-297. doi: 10.1080/19336950.2021.1885836. Channels (Austin). 2021. PMID: 33565904 Free PMC article. Review.
Cited by
-
Characterisation of lamina I anterolateral system neurons that express Cre in a Phox2a-Cre mouse line.Sci Rep. 2021 Sep 9;11(1):17912. doi: 10.1038/s41598-021-97105-w. Sci Rep. 2021. PMID: 34504158 Free PMC article.
-
Cross Talk of BDNF and GDNF in Spinal Substantia Gelatinosa (Lamina II): Focus on Circuitry.Adv Exp Med Biol. 2021;1331:215-229. doi: 10.1007/978-3-030-74046-7_14. Adv Exp Med Biol. 2021. PMID: 34453301
-
Neurokinin 1 receptor activation in the rat spinal cord maintains latent sensitization, a model of inflammatory and neuropathic chronic pain.Neuropharmacology. 2020 Oct 15;177:108253. doi: 10.1016/j.neuropharm.2020.108253. Epub 2020 Jul 29. Neuropharmacology. 2020. PMID: 32736088 Free PMC article.
-
Selective-cold output through a distinct subset of lamina I spinoparabrachial neurons.Pain. 2020 Jan;161(1):185-194. doi: 10.1097/j.pain.0000000000001710. Pain. 2020. PMID: 31577643 Free PMC article.
-
Inflammation-induced GluA1 trafficking and membrane insertion of Ca2+ permeable AMPA receptors in dorsal horn neurons is dependent on spinal tumor necrosis factor, PI3 kinase and protein kinase A.Exp Neurol. 2017 Jul;293:144-158. doi: 10.1016/j.expneurol.2017.04.004. Epub 2017 Apr 12. Exp Neurol. 2017. PMID: 28412220 Free PMC article.
References
-
- Almarestani L., Waters S.M., Krause J.E., Bennett G.J., Ribeiro-da-Silva A. Morphological characterization of spinal cord dorsal horn lamina I neurons projecting to the parabrachial nucleus in the rat. J Comp Neurol. 2007;504:287–297. - PubMed
Publication types
MeSH terms
Substances
Grants and funding
LinkOut - more resources
Full Text Sources
