. 2010 May;183(5):2045-53.
doi: 10.1016/j.juro.2009.12.092. Epub 2010 Mar 19.

Expression of pluripotent stem cell reprogramming factors by prostate tumor initiating cells

Affiliations

Expression of pluripotent stem cell reprogramming factors by prostate tumor initiating cells

Kyung-Mi Bae et al. J Urol. 2010 May.

Abstract

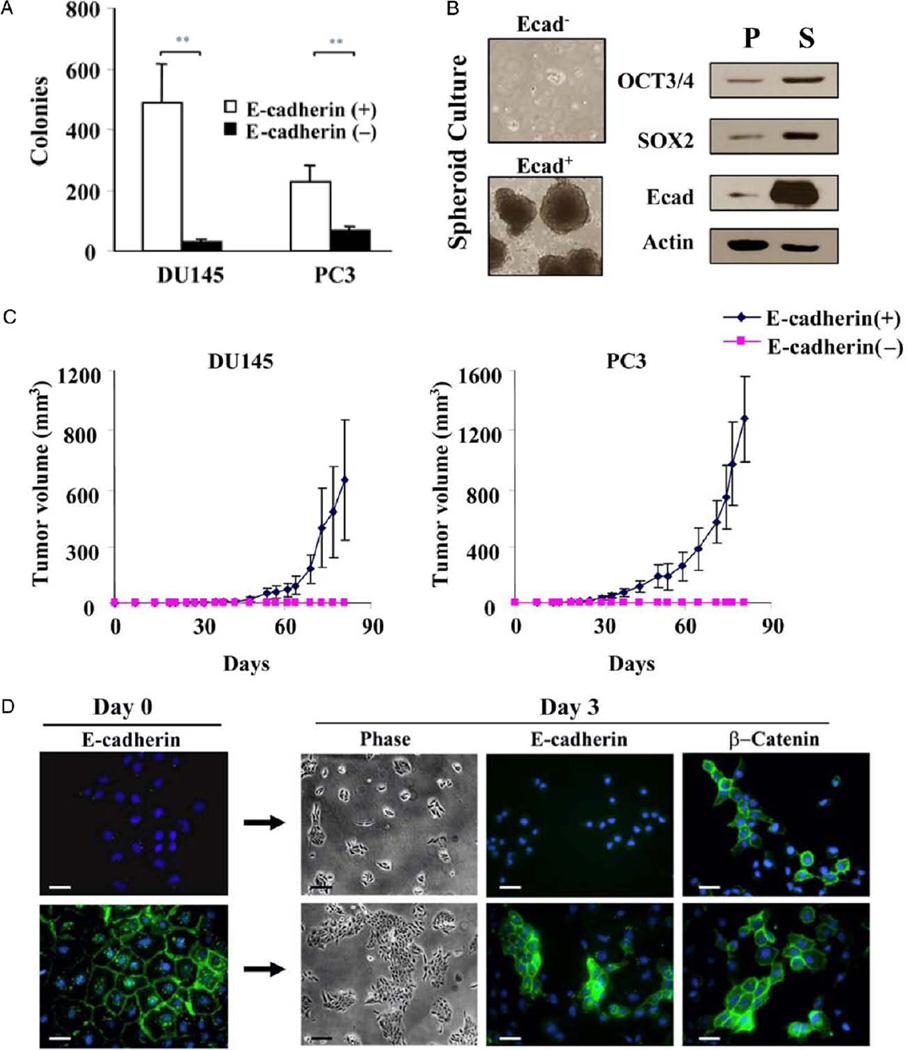
Purpose: We identified a discrete population of stem cell-like tumor cells expressing 5 essential transcription factors required to reprogram pluripotency in prostate tumor cell lines and primary prostate cancer tissue.

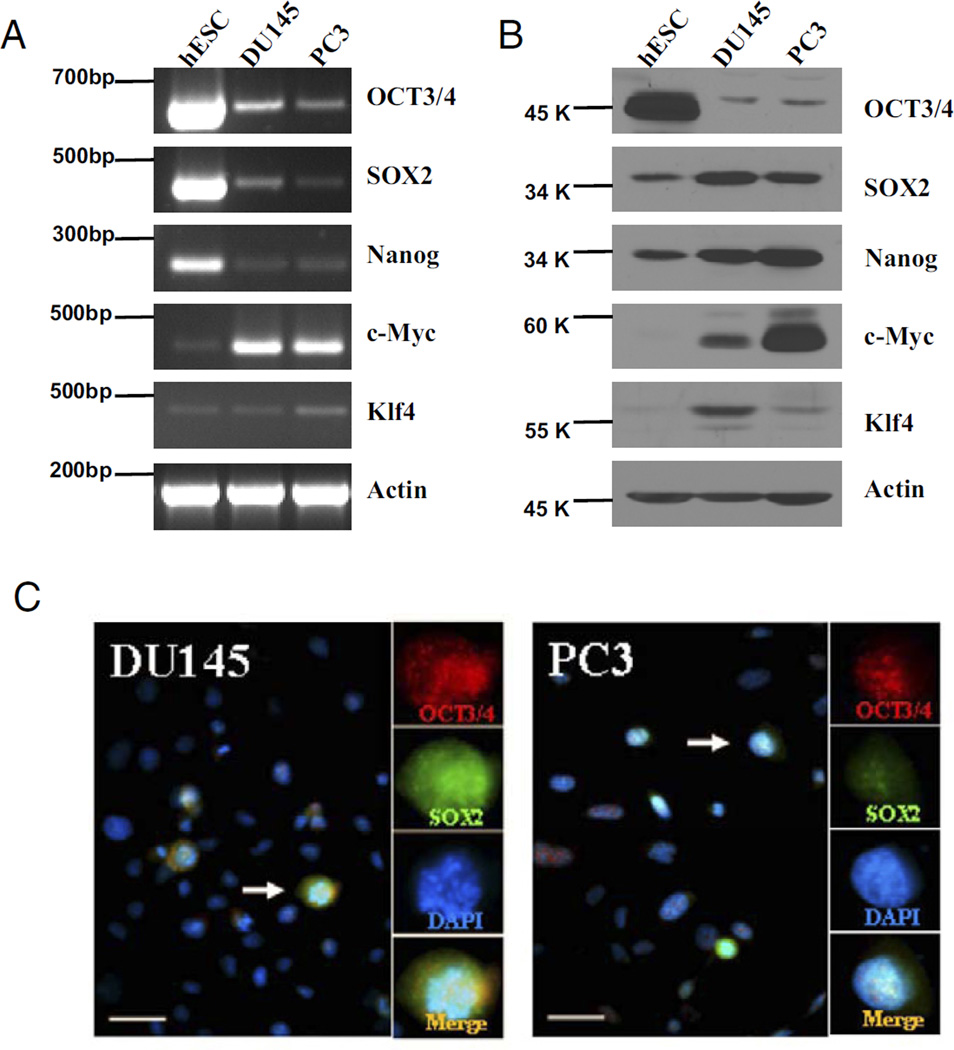
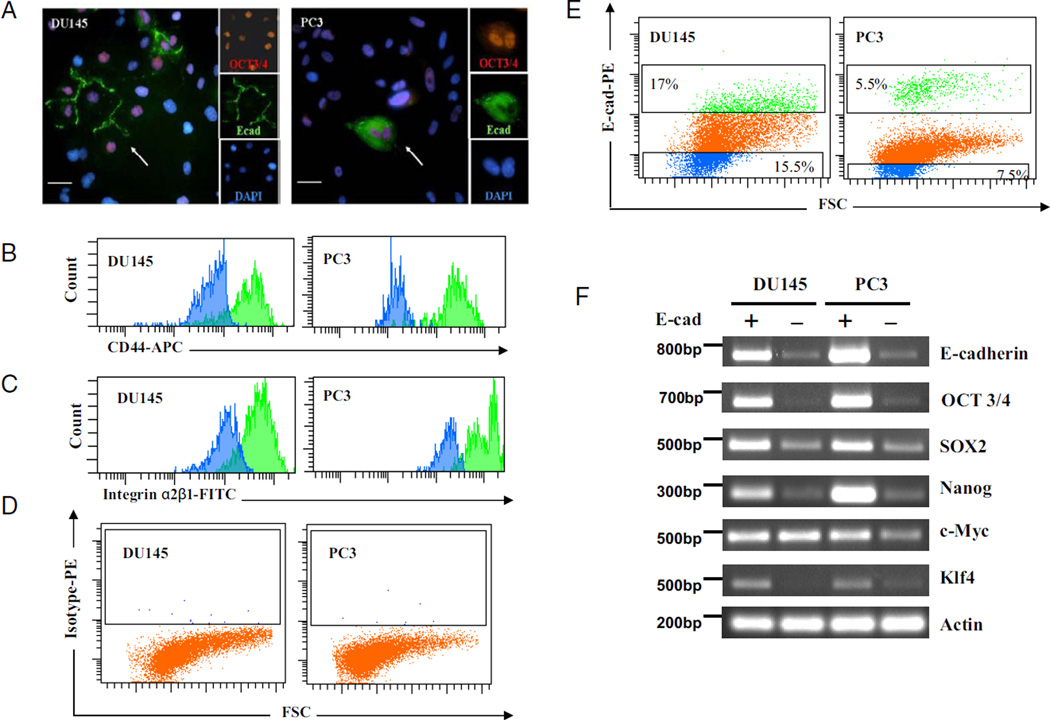
Materials and methods: DU145 and PC3 human prostate cancer cell lines (ATCC), tumor tissue from patients with prostate cancer and normal prostate tissue were evaluated for the reprogramming factors OCT3/4 (Cell Signaling Technology), SOX2, Klf4 (Santa Cruz Biotechnology, Santa Cruz, California), Nanog (BioLegend) and c-Myc (Cell Signaling) by semiquantitative reverse transcriptase-polymerase chain reaction, histological and immunohistochemical analysis. Stem cell-like tumor cells were enriched by flow cytometric cell sorting using E-cadherin (R&D Systems) as a surface marker, and soft agar, spheroid and tumorigenicity assays to confirm cancer stem cell-like characteristics.

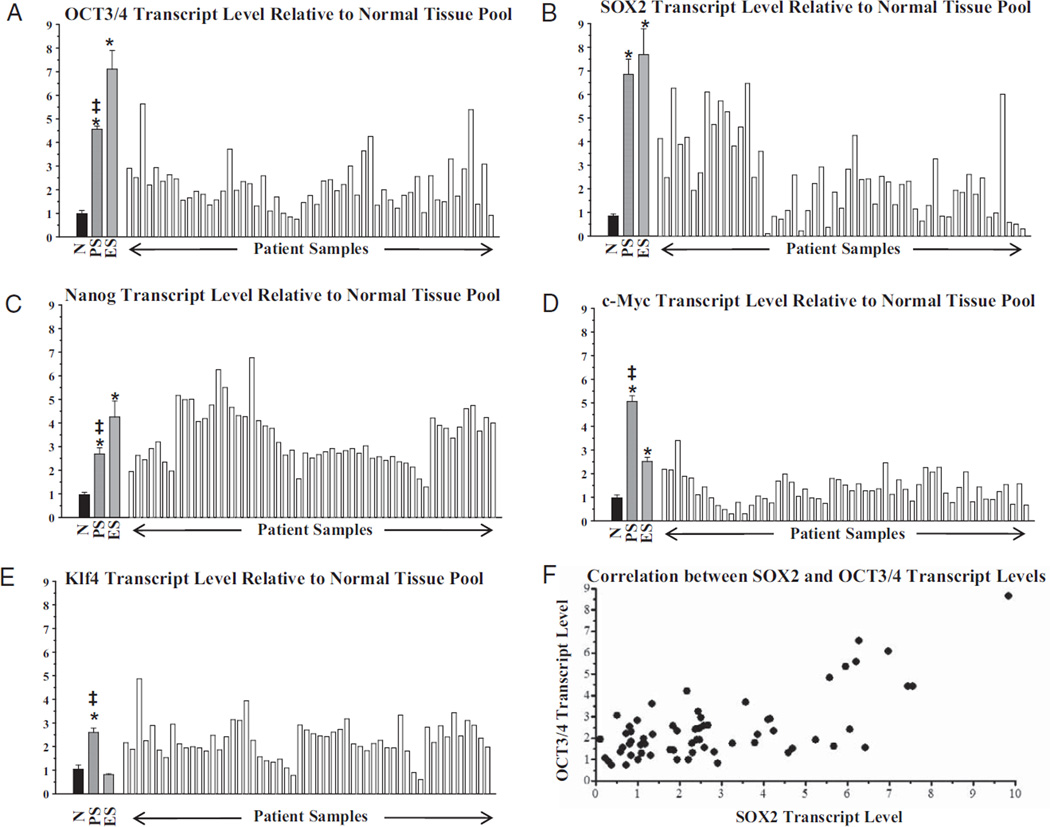
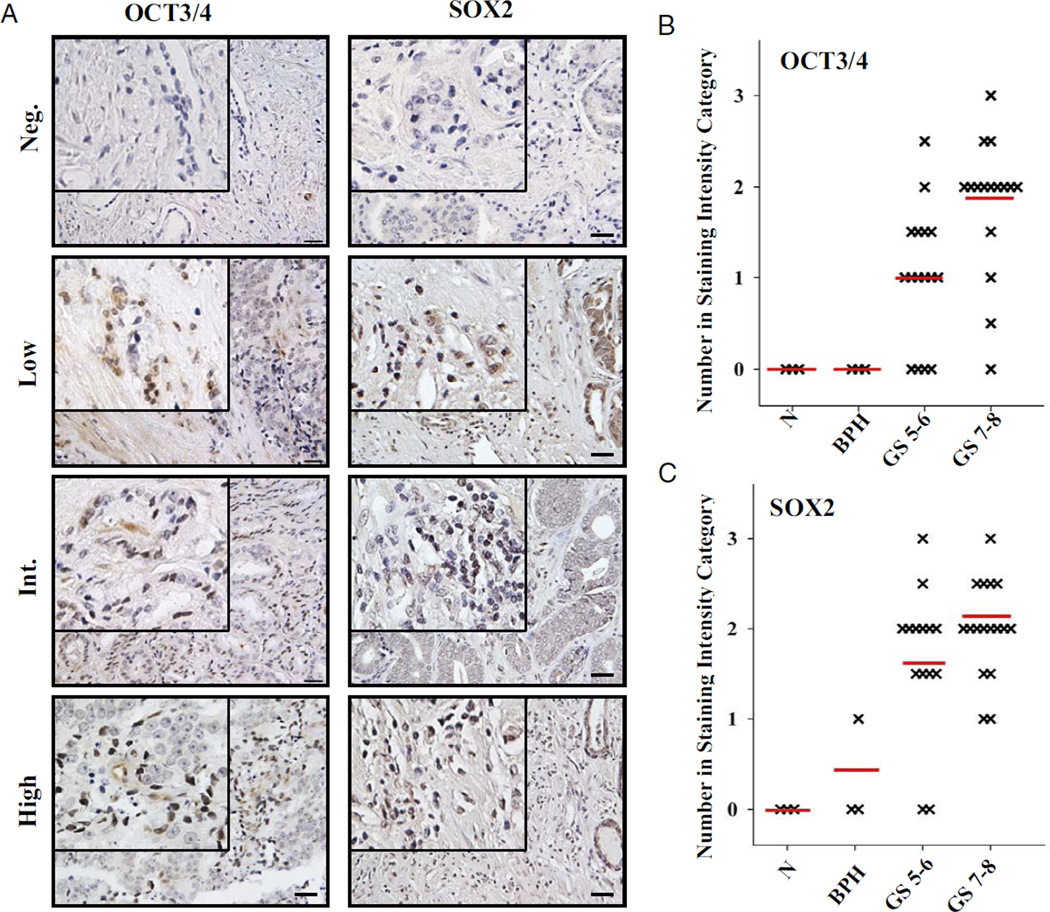
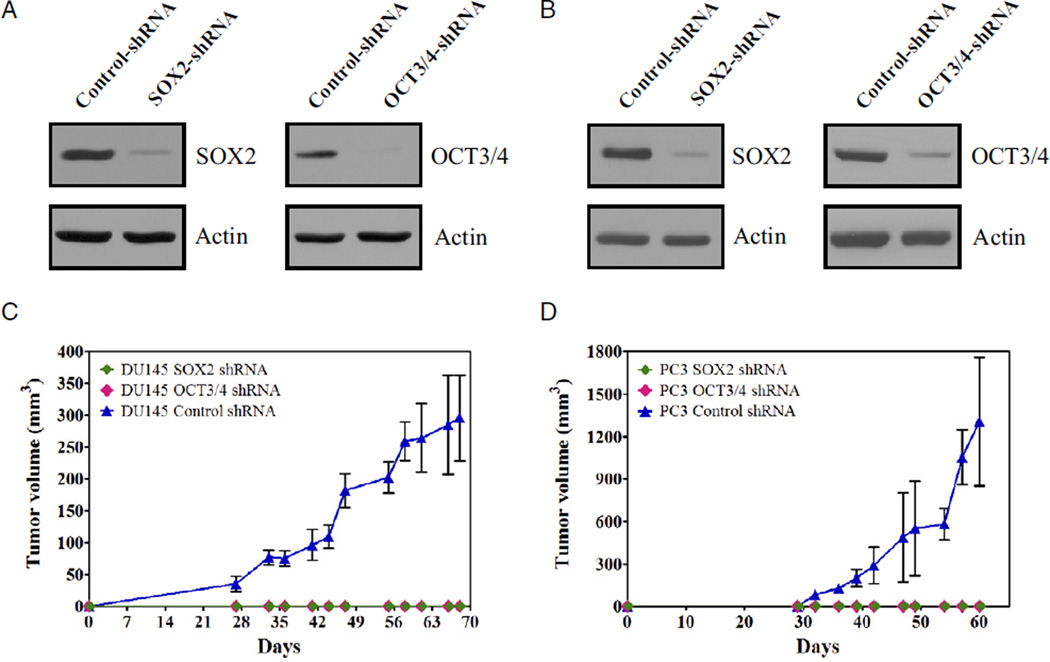
Results: mRNA expression of transcription factors OCT3/4 and SOX2 highly correlated in primary prostate tumor tissue samples. The number of OCT3/4 or SOX2 expressing cells was significantly increased in prostate cancer tissue compared to that in normal prostate or benign prostate hyperplasia tissue (p <0.05). When isolated from the DU145 and PC3 prostate cancer cell lines by flow cytometry, stem cell-like tumor cells expressing high OCT3/4 and SOX2 levels showed high tumorigenicity in immunodeficient mice. In vivo growth of the parental DU145 and PC3 prostate cancer cell lines was inhibited by short hairpin RNA knockdown of OCT3/4 or SOX2.

Conclusions: Data suggest that prostate tumor cells expressing pluripotent stem cell transcription factors are highly tumorigenic. Identifying such cells and their importance in prostate cancer growth could provide opportunities for novel targeting strategies for prostate cancer therapy.


Figures

Figure 1
Figure 1
Representative pluripotent stem cell gene expression results in 3 independent experiments in prostate cancer tissue. A to E, semiquantitative RT-PCR using TissueScan prostate tissue panels shows normal prostate (N), PSs and ESs as controls. Band intensity was calculated using AlphaEase. Transcript levels were normalized to β-actin and are shown as relative units standardized to normal tissue pool. Statistical significance was considered at p <0.05. Asterisk indicates statistically different from normal. Double dagger indicates statistically different from ES. F, relative SOX2 mRNA levels vs relative OCT3/4 mRNA levels in tissue samples (Spearman correlation coefficient 0.4730, p <0.0001). Other possible transcription level combinations did not attain significance.
Figure 2
Figure 2
Immunohistochemical staining for OCT3/4 and SOX2 in human prostate cancer tissues. A, representative results of at least 2 independent experiments reveal immunostaining for OCT3/4 and SOX2 using prostate tissue arrays. Neg., negative. Int., intermediate. Brown areas indicate positive nuclear staining. Reduced from ×20. Scale bar represents 70 µm. Insets, reduced from ×40. B and C, classification of different GS samples based on staining intensity. GS 5–6 and 7–8 tissues were significantly different than normal (N) and BPH tissue (2-tailed Mann-Whitney rank test p <0.05). Red lines indicate mean.
Figure 3
Figure 3
Representative results show identification of stem cell-like tumor cells with pluripotent stem cell reprogramming factors in 3 independent experiments in prostate cancer cell lines. A and B, RT-PCR or Western blot detected OCT3/4, SOX2, Nanog, c-Myc and Klf4 expression in DU145 and PC3 cell lines with human embryonic stem cells (hESC) as control. Data were normalized to β-actin. C, DU145 and PC3 cells were immunostained for OCT3/4 (red areas), SOX2 (green areas) and DAPI (blue areas). Arrow indicates merged OCT3/4 and SOX2 staining (Merge). Scale bar represents 20 µm. Reduced from ×40.
Figure 4
Figure 4
Isolation of stem cell-like prostate tumor cells. A, to identify surface markers for isolating stem cell-like cells from prostate cell lines DU145 and PC3 cells were immunostained for OCT3/4 (red areas), E-cadherin (Ecad) (green areas) and DAPI (blue areas). OCT3/4 and E-cadherin staining was also merged (arrow). Reduced from ×40. Scale bar represents 20 µm. B and C, for phenotypic analysis of DU145 and PC3 cells using double staining with E-cadherin and CD44 or integrin-α2β1 cells were gated on E-cadherin+ (green curves) or E-cadherin (blue curves) population. FITC, fluorescein isothiocyanate. D and E, flow cytometry (FCS) analysis of DU145 and PC3 cells reveals E-cadherin (E-cad) expression. Isotype matched controls were used to set analysis gates for E-cadherin cell sorting. F, representative results of 3 independent experiments show that RT-PCR identified OCT3/4, SOX2, Nanog, c-Myc and Klf4 expression in E-cadherin+ and E-cadherin cells isolated from DU145 and PC3 cells. Data were normalized to β-actin.
Figure 5
Figure 5
Functional analysis of stem cell-like prostate tumor cells. A, colony forming assay using sorted E-cadherin+ and E-cadherin cells shows mean ± SD of 2 independent experiments. Asterisks indicate p <0.01. B, spheroid culture assay in E-cadherin (Ecad) sorted cells. Western blot of unsorted parental line (P) and E-cadherin+ spheroids (S) demonstrates OCT3/4, SOX2 and E-cadherin protein levels. Data were normalized to β-actin. Reduced from ×5. C, tumorigenic assay of sorted E-cadherin+ and E-cadherin cells reveals representative mean ± SD tumor volume in 5 SCID mice per group in 2 independent experiments. D, immunostaining of E-cadherin and E-cadherin+ DU145 cells with E-cadherin or β-catenin antibodies during 3-day differentiation. Phase contrast microscopy reduced from ×5 (scale bar indicates 100 µm). Fluorescence microscopy reduced from ×40 (scale bar indicates 20 µm).
Figure 6
Figure 6
OCT3/4 or SOX2 knockdown tumorigenicity in DU145 and PC3 cells. A and B, Western blot shows decreased OCT3/4 or SOX2 protein levels in human DU145 and PC3 prostate cancer cells transfected with shRNA. Unsorted DU145 (1 × 10⁵) or PC3 (3 × 10⁵) cells were subcutaneously injected in SCID mice. C and D, mean ± SD tumor volume after OCT 3/4, SOX2 or control shRNA treatment.

Similar articles

Cited by

References

    1. Jemal A, Siegel R, Ward E, et al. Cancer statistics. CA Cancer J Clin. 2008;58:71. - PubMed
    1. Nelson WG, De Marzo AM, Isaacs WB. Prostate cancer. N Engl J Med. 2003;349:366. - PubMed
    1. Lawson DA, Xin L, Lukacs R, et al. Prostate stem cells and prostate cancer. Cold Spring Harb Symp Quant Biol. 2005;70:187. - PubMed
    1. Jordan CT, Guzman ML, Noble M. Cancer stem cells. N Engl J Med. 2006;355:1253. - PubMed
    1. Rossi DJ, Weissman IL. Pten, tumorigenesis, and stem cell self-renewal. Cell. 2006;125:229. - PubMed

Publication types

MeSH terms