

Granger causality relationships between local field potentials in an animal model of temporal lobe epilepsy
- PMID: 20304005
- PMCID: PMC2867107
- DOI: 10.1016/j.jneumeth.2010.03.007
Granger causality relationships between local field potentials in an animal model of temporal lobe epilepsy
Abstract
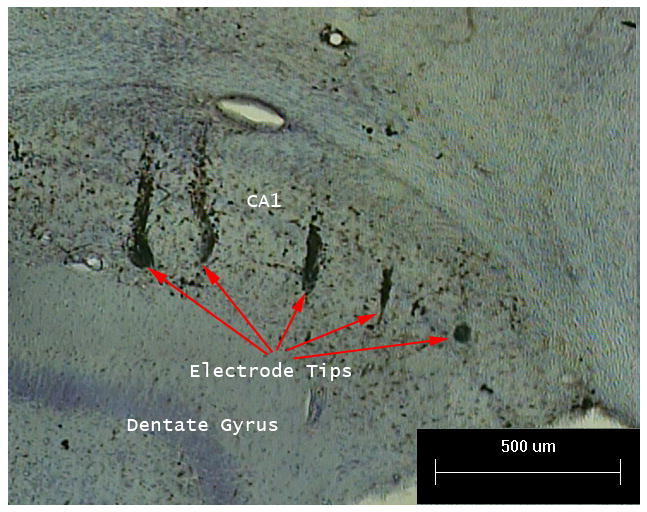
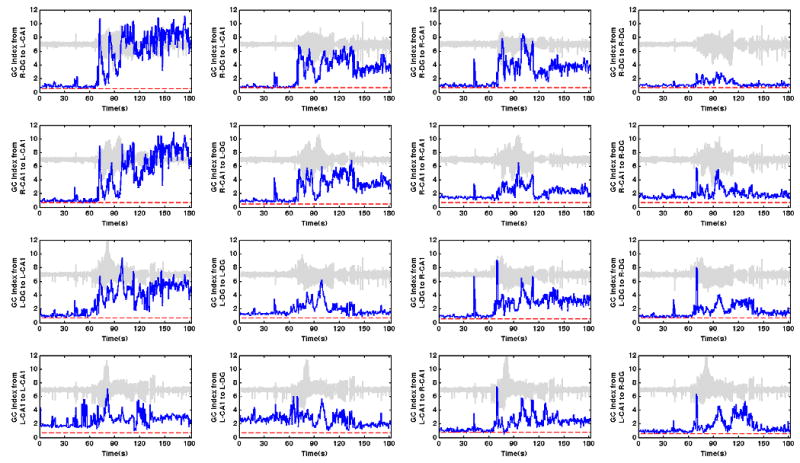
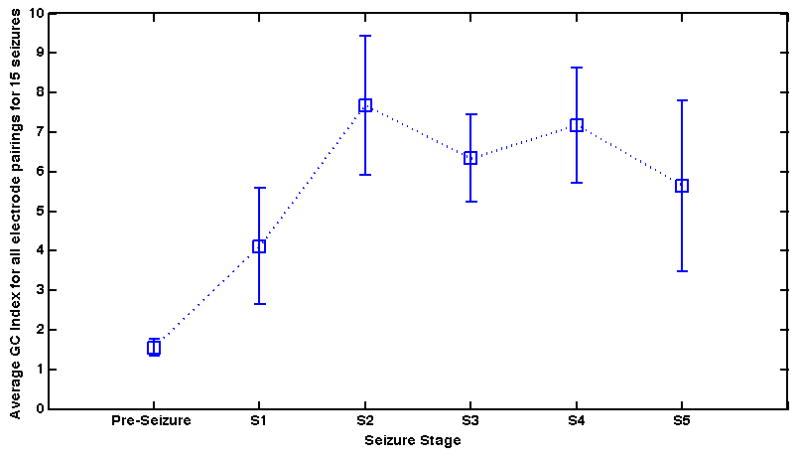
An understanding of the in vivo spatial emergence of abnormal brain activity during spontaneous seizure onset is critical to future early seizure detection and closed-loop seizure prevention therapies. In this study, we use Granger causality (GC) to determine the strength and direction of relationships between local field potentials (LFPs) recorded from bilateral microelectrode arrays in an intermittent spontaneous seizure model of chronic temporal lobe epilepsy before, during, and after Racine grade partial onset generalized seizures. Our results indicate distinct patterns of directional GC relationships within the hippocampus, specifically from the CA1 subfield to the dentate gyrus, prior to and during seizure onset. Our results suggest sequential and hierarchical temporal relationships between the CA1 and dentate gyrus within and across hippocampal hemispheres during seizure. Additionally, our analysis suggests a reversal in the direction of GC relationships during seizure, from an abnormal pattern to more anatomically expected pattern. This reversal correlates well with the observed behavioral transition from tonic to clonic seizure in time-locked video. These findings highlight the utility of GC to reveal dynamic directional temporal relationships between multichannel LFP recordings from multiple brain regions during unprovoked spontaneous seizures.
(c) 2010 Elsevier B.V. All rights reserved.
Figures


Similar articles
-
Preictal activity of subicular, CA1, and dentate gyrus principal neurons in the dorsal hippocampus before spontaneous seizures in a rat model of temporal lobe epilepsy.J Neurosci. 2014 Dec 10;34(50):16671-87. doi: 10.1523/JNEUROSCI.0584-14.2014. J Neurosci. 2014. PMID: 25505320 Free PMC article.
-
Hippocampal and entorhinal cortex high-frequency oscillations (100--500 Hz) in human epileptic brain and in kainic acid--treated rats with chronic seizures.Epilepsia. 1999 Feb;40(2):127-37. doi: 10.1111/j.1528-1157.1999.tb02065.x. Epilepsia. 1999. PMID: 9952257
-
Changes in granule cell firing rates precede locally recorded spontaneous seizures by minutes in an animal model of temporal lobe epilepsy.J Neurophysiol. 2008 May;99(5):2431-42. doi: 10.1152/jn.01369.2007. Epub 2008 Mar 5. J Neurophysiol. 2008. PMID: 18322007
-
Spike-wave discharges in adult Sprague-Dawley rats and their implications for animal models of temporal lobe epilepsy.Epilepsy Behav. 2014 Mar;32:121-31. doi: 10.1016/j.yebeh.2014.01.004. Epub 2014 Feb 15. Epilepsy Behav. 2014. PMID: 24534480 Free PMC article. Review.
-
On the role of somatostatin in seizure control: clues from the hippocampus.Rev Neurosci. 2003;14(3):285-301. doi: 10.1515/revneuro.2003.14.3.285. Rev Neurosci. 2003. PMID: 14513869 Review.
Cited by
-
Ictal High-Frequency Oscillation for Lateralizing Patients With Suspected Bitemporal Epilepsy Using Wavelet Transform and Granger Causality Analysis.Front Neuroinform. 2019 Jun 28;13:44. doi: 10.3389/fninf.2019.00044. eCollection 2019. Front Neuroinform. 2019. PMID: 31316364 Free PMC article.
-
Bibliometric Analysis of Granger Causality Studies.Entropy (Basel). 2023 Apr 7;25(4):632. doi: 10.3390/e25040632. Entropy (Basel). 2023. PMID: 37190420 Free PMC article.
-
[Research on effective connectivity of intracerebral electroencephalogram based on Wiener-Granger Causality Index modified by generalized Akaike's Information Criterion].Sheng Wu Yi Xue Gong Cheng Xue Za Zhi. 2018 Oct 25;35(5):665-671. doi: 10.7507/1001-5515.201709032. Sheng Wu Yi Xue Gong Cheng Xue Za Zhi. 2018. PMID: 30370703 Free PMC article. Chinese.
-
Cross-correlation of instantaneous amplitudes of field potential oscillations: a straightforward method to estimate the directionality and lag between brain areas.J Neurosci Methods. 2010 Aug 30;191(2):191-200. doi: 10.1016/j.jneumeth.2010.06.019. Epub 2010 Jun 30. J Neurosci Methods. 2010. PMID: 20600317 Free PMC article.
-
Granger causality analysis of rat cortical functional connectivity in pain.J Neural Eng. 2020 Feb 7;17(1):016050. doi: 10.1088/1741-2552/ab6cba. J Neural Eng. 2020. PMID: 31945754 Free PMC article.
References
-
- Akaike H. A new look at the statistical model identification. IEEE Transactions on Automatic Control. 1974;19:716–23.
-
- Amaral D, Lavenex P. Hippocampal Neuroanatomy. In: Andersen P, Morris R, Amaral T, Bliss T, O'Keefe J, editors. The Hippocampus Book. Oxford University Press; Oxford: 2007. pp. 37–114.
-
- Avoli M, D'Antuono M, Louvel J, Köhling R, Biagini G, Pumain R, D'Arcangelo G, Tancredi V. Network and pharmacological mechanisms leading to epileptiform synchronization in the limbic system in vitro. Prog Neurobiol. 2002;68:167–207. - PubMed
Publication types
MeSH terms
Grants and funding
LinkOut - more resources
Full Text Sources
Other Literature Sources
Miscellaneous
