

Risk stratification of men choosing surveillance for low risk prostate cancer
- PMID: 20304433
- PMCID: PMC3474981
- DOI: 10.1016/j.juro.2010.01.001
Risk stratification of men choosing surveillance for low risk prostate cancer
Abstract
Purpose: We sought to predict biopsy progression in men on prostate cancer surveillance.
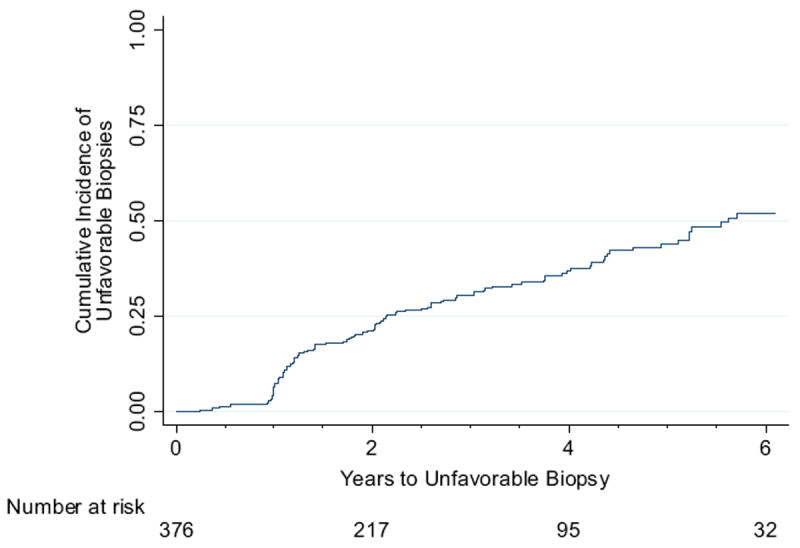
Materials and methods: A total of 376 men with a median age of 65.5 years (range 45.8 to 79.5) with low risk prostate cancer on surveillance underwent at least 1 followup biopsy after diagnosis. Progression was defined at surveillance biopsy as Gleason pattern 4 or 5, greater than 2 biopsy cores with cancer or greater than 50% involvement of any core with cancer. Proportional hazards analysis was used to evaluate the association between covariates and progression at surveillance biopsy. The Kaplan-Meier method was used to estimate the probability of disease progression.
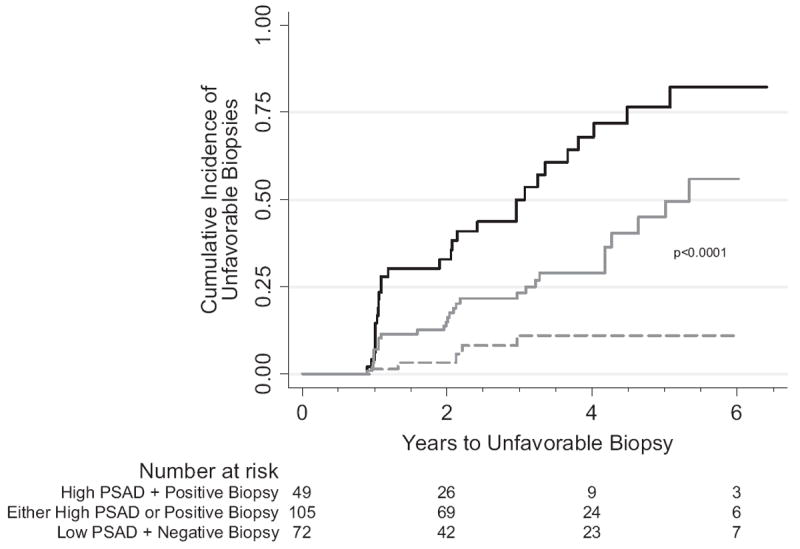
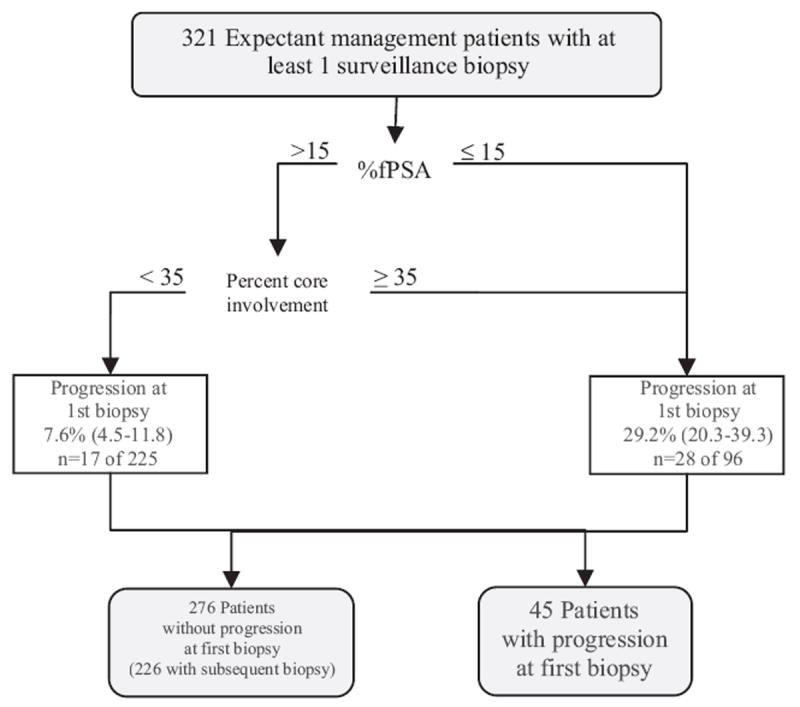
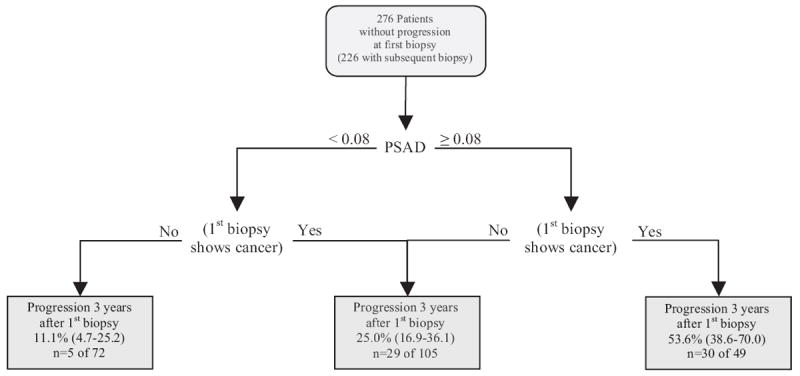
Results: Of the 376 men 123 (32.7%) had progression a median of 5.6 years (range 0.3 to 8.5) after diagnosis. Percent free PSA and maximum percent core involvement at diagnosis were associated with progression, allowing stratification of the progression risk at initial surveillance biopsy. Cancer presence and PSA density at initial surveillance biopsy were associated with subsequent progression, allowing stratification of the cumulative incidence of progression 3 years after initial surveillance biopsy (cumulative incidence 11.1%, 95% CI 4.7 to 25.2 for negative biopsy and PSAD less than 0.08 ng/ml/cm(3) vs 53.6%, 95% CI 38.6 to 70.0 for positive biopsy and PSAD 0.08 ng/ml/cm(3) or greater, log rank test p <0.0001).
Conclusions: Clinical variables at diagnosis and at first surveillance biopsy during followup in an active surveillance program can be used to inform men about the likelihood of an unfavorable prostate biopsy. This information could improve patient and physician acceptance of active surveillance in carefully selected men.
2010 American Urological Association Education and Research, Inc. Published by Elsevier Inc. All rights reserved.
Figures
References
-
- Schröder FH, Hugosson J, Roobol MJ, et al. Screening and prostate-cancer mortality in a randomized European study. N Engl J Med. 2009;360:1320. - PubMed
-
- Etzioni R, Penson DF, Legler JM, et al. Overdiagnosis due to prostate-specific antigen screening: lessons from U.S. prostate cancer incidence trends. J Natl Cancer Inst. 2002;94:981. - PubMed
-
- Draisma G, Boer R, Otto SJ, et al. Lead times and overdetection due to prostate-specific antigen screening: estimates from the European Randomized Study of Screening for Prostate Cancer. J NatlCancer Inst. 2003;95:868. - PubMed
-
- Telesca D, Etzioni R, Gulati R. Estimating lead time and overdiagnosis associated with PSA screening from prostate cancer incidence trends. Biometrics. 2008;64:10. - PubMed
Publication types
MeSH terms
Grants and funding
LinkOut - more resources
Full Text Sources
Medical
Research Materials
Miscellaneous
