

Temporal dynamics of spontaneous MEG activity in brain networks
- PMID: 20304792
- PMCID: PMC2851876
- DOI: 10.1073/pnas.0913863107
Temporal dynamics of spontaneous MEG activity in brain networks
Abstract
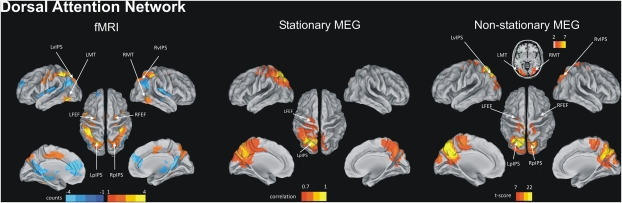
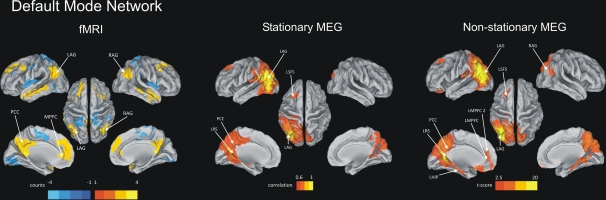
Functional MRI (fMRI) studies have shown that low-frequency (<0.1 Hz) spontaneous fluctuations of the blood oxygenation level dependent (BOLD) signal during restful wakefulness are coherent within distributed large-scale cortical and subcortical networks (resting state networks, RSNs). The neuronal mechanisms underlying RSNs remain poorly understood. Here, we describe magnetoencephalographic correspondents of two well-characterized RSNs: the dorsal attention and the default mode networks. Seed-based correlation mapping was performed using time-dependent MEG power reconstructed at each voxel within the brain. The topography of RSNs computed on the basis of extended (5 min) epochs was similar to that observed with fMRI but confined to the same hemisphere as the seed region. Analyses taking into account the nonstationarity of MEG activity showed transient formation of more complete RSNs, including nodes in the contralateral hemisphere. Spectral analysis indicated that RSNs manifest in MEG as synchronous modulation of band-limited power primarily within the theta, alpha, and beta bands-that is, in frequencies slower than those associated with the local electrophysiological correlates of event-related BOLD responses.
Conflict of interest statement
The authors declare no conflict of interest.
Figures
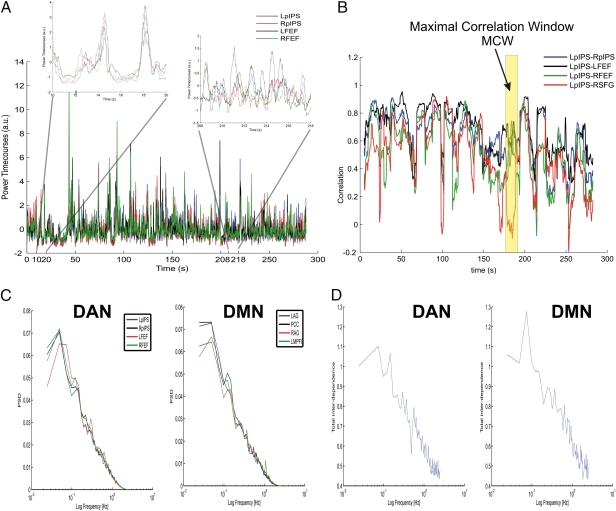
 (Eq. 3;
  ) evaluated at time increments of 0.2 s. (C) Power spectral densities (PSD) of wide-band power (Eq. 2) in DAN and DMN nodes averaged across sessions and subjects. (D) Total interdependence measure (
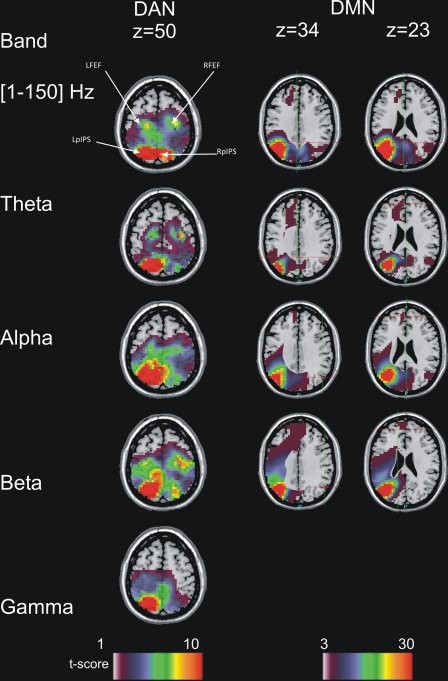
References
-
- Biswal B, Yetkin FZ, Haughton VM, Hyde JS. Functional connectivity in the motor cortex of resting human brain using echo-planar MRI. Magn Reson Med. 1995;34:537–541. - PubMed
-
- Fox MD, Snyder AZ, Vincent JL, Raichle ME. Intrinsic fluctuations within cortical systems account for intertrial variability in human behavior. Neuron. 2007;56:171–184. - PubMed
-
- He BJ, et al. Breakdown of functional connectivity in frontoparietal networks underlies behavioral deficits in spatial neglect. Neuron. 2007;53:905–918. - PubMed
-
- Logothetis NK, Pauls J, Augath M, Trinath T, Oeltermann A. Neurophysiological investigation of the basis of the fMRI signal. Nature. 2001;412:150–157. - PubMed
Publication types
MeSH terms
Substances
Grants and funding
LinkOut - more resources
Full Text Sources
